Download
1 / 17
170 likes | 362 Views
ROMS: Real Ocean Modeling Stories or Reasons Ocean Modeling Sucks. Sally Warner tOAStER, Friday Harbor Labs January 25, 2008. Motivation. PO students and faculty have discussed the need for a modeling class, but no class has been taught yet.

E N D
ROMS: Real Ocean Modeling StoriesorReasons Ocean Modeling Sucks Sally Warner tOAStER, Friday Harbor Labs January 25, 2008
Motivation • PO students and faculty have discussed the need for a modeling class, but no class has been taught yet. • I have been approached by numerous grad students with the question, “How hard would it be for me to model region X?”
What is ROMS? • ROMS: Regional Ocean Modeling System • Free code is maintained by oceanographers/computer scientists at Rutgers University • ROMS is one of many ocean models (POM, HIM, etc.), but probably the most advanced and widely used.
How does ROMS work? ROMS is simply thousands of lines of Fortran code 1. Edit or add code that tell ROMS what you want it to do (days to weeks) 2. Compile the code (minutes, need a Fortran compiler) 3. Run the code (hours to days, need a fast computer or lots of time) 4. Analyze the output which come as NetCDF files (months, need MATLAB) 5. Debug and repeat (months to years)
Setting up the code • Bathymetry • Grid • Time stepping • Stratification • Forcing • Boundary Conditions • Nudging All of these parameters can be defined analytically in ROMS or you can read in data from external files.
Analytic bathymetry Nonlinear/analytical.f # elif defined TTP1 Xsize=20.00E+03_r8 Esize= 10.00E+03_r8 depth=200.0_r8 f0=0.0_r8 beta=0.0_r8 Nonlinear/analytical.f # elif defined TTP1 DO j=JstrR,JendR DO i=IstrR,IendR val = (xr(i,j)-(Xsize/2.0_r8))/1000.0_r8 h(i,j)=depth-5.0_r8*EXP(-(val*val)) END DO END DO
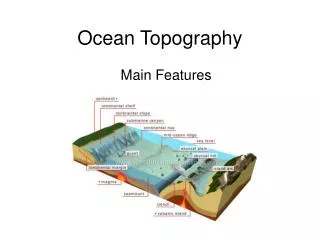
Complicated bathymetry Any land (except straight side-walls) must have a land mask. Real bathymetry must be smoothed before sending it to ROMS.
Grid • Terrain-following vertical grid (a.k.a. S-coordinate grid) • rho-grid: temp and salinity (5x3) • u-grid: x-direction velocity (6x3) • v-grid: y-direction velocity (5x4)
Time stepping CFL (Courant, Friedricks, Lewy) condition determines the size of the time step: >> One M2 tidal cycle = 44712 s >> 20 tidal cycle run = 900,000 time steps * Luckily, if you break CFL conditions, you will know
Forcing and boundary conditions # elif defined TTP1 IF (WESTERN_EDGE) THEN fac=TANH((tdays(ng)-dstart)/1.0_r8) omega=2.0_r8*pi*time(ng)/(12.42_r8*3600.0_r8) val=1.0_r8 phase=0.0_r8*deg2rad DO j=JstrR,JendR BOUNDARY(ng)%zeta_west(j)=fac*val*SIN(omega-phase) END DO END IF
PROBLEM: Incorrect boundary conditions Test #44 channel entrance channel exit
PROBLEM: Incorrect BCs Test #45 Test #46 Test #49 Test #51
Nudging Nudging forces velocity near edges to a prescribed value. Test #61 - with nudging Time averaged velocity at 3 depths Test #44 - without nudging Time averaged velocity at 3 depth
Advantages to modeling • Know values of all parameters (velocity, salinity, temperature, etc.) at every single grid point. • Don’t need a ship or fancy instrumentation = less money. • Easily test “what ifs” (e.g. I’ve got my model running accurately, what if the tides were twice as fast?) • Modeling can fill in holes in measurements.
Disadvantages to modeling • The answer can seem so right, but is it? • Need a powerful computer with lots of storage space. • A modeler must not be scared of computer code, MATLAB or computers. • Must have patience. (But who doesn’t need patience in grad school.)


![Data Modeling [Comparison of data modeling techniques ]](https://cdn0.slideserve.com/205866/data-modeling-comparison-of-data-modeling-techniques-dt.jpg)