Download
1 / 10

E N D
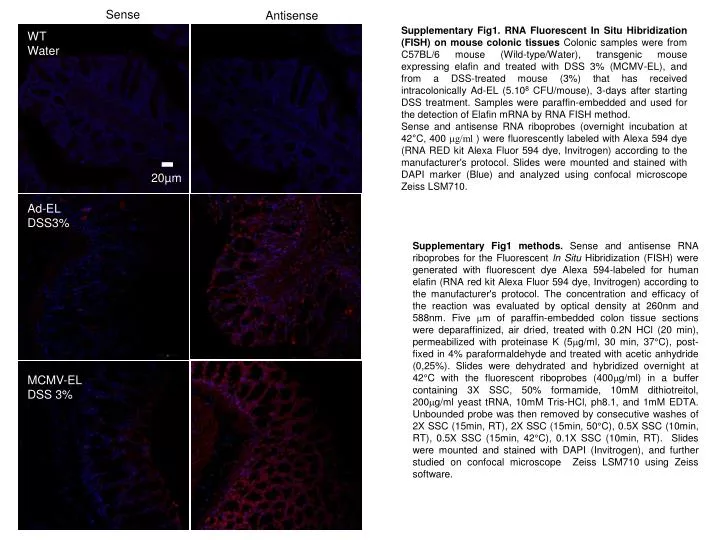
Sense Antisense Supplementary Fig1. RNA Fluorescent In Situ Hibridization (FISH) on mouse colonic tissues Colonic samples were from C57BL/6 mouse (Wild-type/Water), transgenic mouse expressing elafin and treated with DSS 3% (MCMV-EL), and from a DSS-treated mouse (3%) that has received intracolonically Ad-EL (5.108 CFU/mouse), 3-days after starting DSS treatment. Samples were paraffin-embedded and used for the detection of Elafin mRNA by RNA FISH method. Sense and antisense RNA riboprobes (overnight incubation at 42°C, 400 g/ml ) were fluorescently labeled with Alexa 594 dye (RNA RED kit Alexa Fluor 594 dye, Invitrogen) according to the manufacturer's protocol. Slides were mounted and stained with DAPI marker (Blue) and analyzed using confocal microscope Zeiss LSM710. WT Water 20µm Ad-EL DSS3% Supplementary Fig1 methods. Sense and antisense RNA riboprobes for the Fluorescent In Situ Hibridization (FISH) were generated with fluorescent dye Alexa 594-labeled for human elafin (RNA red kit Alexa Fluor 594 dye, Invitrogen) according to the manufacturer's protocol. The concentration and efficacy of the reaction was evaluated by optical density at 260nm and 588nm. Five m of paraffin-embedded colon tissue sections were deparaffinized, air dried, treated with 0.2N HCl (20 min), permeabilized with proteinase K (5g/ml, 30 min, 37°C), post-fixed in 4% paraformaldehyde and treated with acetic anhydride (0,25%). Slides were dehydrated and hybridized overnight at 42°C with the fluorescent riboprobes (400g/ml) in a buffer containing 3X SSC, 50% formamide, 10mM dithiotreitol, 200g/ml yeast tRNA, 10mM Tris-HCl, ph8.1, and 1mM EDTA. Unbounded probe was then removed by consecutive washes of 2X SSC (15min, RT), 2X SSC (15min, 50°C), 0.5X SSC (10min, RT), 0.5X SSC (15min, 42°C), 0.1X SSC (10min, RT). Slides were mounted and stained with DAPI (Invitrogen), and further studied on confocal microscope Zeiss LSM710 using Zeiss software. MCMV-EL DSS 3%
0 1 2 3 A 6 wild-type 5 MCMV-EL 4 Endo-EL 3 * 2 Supplementary Fig2. Weight loss after DSS or TNBS treatment Male C57/Bl6 wild-type (WT), MCMV-EL, Endo-EL mice drank either water (n= 9, 6, 5, respectively) or DSS (n= 11, 8, 8, respectively) (A) or received intracolonically TNBS (n = 7, 5, 4, respectively) (B) were weighed daily. * denotes statistical significance (p<0.05), when compared to the WT treated group. * Weight loss (g) * 1 * * * 0 -1 -2 0 1 2 3 4 5 6 7 Days after DSS w i l d - t y p e B MCMV-EL 6 . 5 Endo-EL 6 . 0 5 . 5 5 . 0 4 . 5 4 . 0 3 . 5 3 . 0 Weigth loss (g) * * 2 . 5 * 2 . 0 * * 1 . 5 * * 1 . 0 0 . 5 0 . 0 4 5 6 7 D a y s a f t e r T N B S
Anti-sense elafin Sense elafin Control Supplementary Fig3. RNA Fluorescent In Situ Hybridization (FISH) on colonic tissues from human biopsies Non-IBD patients (Control), Crohn's Disease (CD), and Ulcerative Colitis (UC) colonic tissues were paraffin-embedded and used for the detection of Elafin mRNA by RNA FISH method. Sense and antisense RNA riboprobes (overnight incubation at 42°C, 400 g/ml ) were fluorescently labeled with Alexa 594 dye (RNA red kit Alexa Fluor 594 dye, Invitrogen) according to the manufacturer's protocol.Slides were mounted and stained with DAPI marker (Blue) and analyzed using confocal microscope Zeiss LSM710. 20µm CD UC
A Supplementary Fig4. Mice disrupted for the expression of Neutrophil Elastase (NE) and Proteinase 3 (PR3) are protected against the DSS-induced colitis Heterozygous mice disrupted for the expression of both serine protease elastase and proteinase 3 (NE+/-PR3+/-) and wild type littermates (NE+/+PR3+/+) drank either water or treated with DSS 3%. At day 7 after post treatment, animals were sacrificed and macroscopic damage score for the colon was assessed (A). Granulocyte infiltration in colonic tissues was assessed by MPO activity assay (B) and Elastase/PR-3 activity released in the colonic lumen was assessed (C). Statistical significance (* for p<0.05 and ** for P<0.01) is noted compared to the corresponding wild-type littermate-DSS treated group. C B
Control H20 DSS DSS Ad-null DSS Ad-EL Supplementary Fig5. Immunofluorescent staining of zona ocludens 1 (ZO-1) on mice colonic tissue Mice were treated (DSS) or not (Control H20) with DSS 3% and were intracolonically instilled at day 3 post DSS with Adenovirus 5dl70 (Ad-null, 5.108 CFU/mouse) or Adenovirus expressing Elafin (Ad-EL, 5.108 CFU/mouse). Colonic samples were paraffin-embedded and were used for the detection of ZO-1 protein (Red) by immunofluorescence according to a standard protocol (overnight primary antibody incubation, 1/400, rabbit anti-ZO1 from Zymed 40-2300).Slides were mounted and stained with DAPI marker (Blue) and analyzed using confocal microscope Zeiss LSM710. Supplementary Fig5 Methods: Zona Ocludens-1 (ZO-1) immunostaining was performed on formalin-fixed mouse colons, embedded in paraffin. Slides were incubated overnight with anti-ZO-1 antibody (Zymed 40-2300, San Francisco, USA, concentration 1/400), washed 3-times in Tris-Buffer-Saline, tween-100 0.1 % in bovine serum albumine 1%, and incubated 1-h with 1/1000 Donkey anti-rabbit Alexa-555 (Invitrogen, Invitrogen, Cergy Pontoise, France).
A Supplementary Fig6. Intracolonic instillation of Adenovirus-elafin did not provide further protection in NE+/-PR3+/-mice during DSS-induced colitis Heterozygous mice disrupted for the expression of both serine protease elastase and proteinase 3 (NE+/-PR3+/-) and littermate group drank either water or DSS 3% and were treated by intracolonic instillation of adenovirus 5dl70 (Ad-null) or adenovirus expressing Elafin (Ad-Elafin). Seven days post DSS treatment, animals were sacrificed and macroscopic damage score was assessed in colonic tissues (A). Granulocyte infiltration in colonic tissues was evaluated by MPO activity assay (B) and results were normalized to the amount of proteins (mg) in the tissues. B
Table 1 Supplementary Microscopic inflammatory parameter scoring in wild-type or elafin transgenic mice, 7 days after DSS- or TNBS-induced colitis or in non-inflamed mice. Male C57/Bl6 WT, MCMV-EL and Endo-EL mice drank either water (n= 9, 6, 5 respectively) or DSS (n= 11, 8, 8, respectively) or were challenged by intracolonic administration of TNBS (n = 7, 5, 4 respectively). Seven days later, mice were sacrificed and colons prepared for histology Microscopic damage was assessed blindly and independently by two pathologists (M. Huerre and Z. Xing) and a score ranging from 0 to 10 was given to 3 variables: epithelial cell injury, mucosal gland destruction and inflammatory cells infiltration in mucosa/submucosa. Numbers represent mean +/- SD. For each variable analyzed, *represents statistical significance for p<0.05, compared to the DSS- or TNBS-treatment-corresponding WT group. Mucosal gland destruction Inflammatory cells infiltration in mucosa/submucosa Treatment Epithelial cell injury Strain 0 0 WT 0 Water 0 MCMC-El 0 0 0 Endo-El 0 0 WT 6.2 +/-1.3 7.7 +/-1.0 7.7 +/-1.1 * * * 2.4 +/-0.8 3.9 +/-1.0 3.1 +/-0.7 DSS MCMV-El P<0.01 P<0.006 P<0.003 * * * 1.8 +/-0.8 1.6 +/-0.7 2.0 +/-1.0 Endo-El P=0.001 P<0.006 P<0.002 WT 1.9 +/-0.7 1.7 +/-0.7 2.1 +/-0.3 * 0.5 +/-0.0 1.5 +/-1.2 0.7 +/-0.3 MCMV-El TNBS P<0.0012 * * 1.7 +/-0.4 0.2 +/-0.2 0.4 +/-0.1 Endo-El P<0.04 P<0.0007
Table 2 Supplementary Pro-inflammatory cytokines mRNA production in wild-type and elafin transgenic mice after the induction or not of DSS colitis Male C57/Bl6 WT, MCMV-EL, Endo-EL mice drank either water (n= 9, 6, 5, respectively) or DSS (n= 11, 8, 8, respectively) for a 7-days period. Q-PCR analysis was performed to determine relative quantification (RQ) of mRNA levels of KC, MIP-1, MIP-2, RANTES, compared to GAPDH levels, using the Ct method. Values are expressed relatively to the quantification of samples from WT mice drinking water (mean value was given a value of 1). Numbers in brackets beside values represent standard deviation, and numbers in brackets at the right of each row represent the number of animals used. * denotes statistical significance (p<0.05), when compared to the WT H2O-treated group. KC MIP1a MIP2 RANTES Treatment Strain 1.0 1.0 1.0 1.0 Water WT (5) DSS WT (7) 11.7 (0.40) 3.2 (0.24) 1.1 (0.28) 5.0 (0.19) 1.2 (0.66) 0.5 (0.78) 0.4 (0.24) 1.6 (0.11) Water MCMV-EL (5) * * * * DSS 2.4 (1.30) 0.1 (0.69) 2.0 (0.89) MCMV-EL (7) 0.2 (0.13) 0.4 (0.59) 0.4 (0.83) 0.6 (0.58) 3.6 (0.61) Water Endo-EL (5) * * * * DSS Endo-EL (5) 0.8 (0.42) 0.5 (0.70) 0.2 (0.13) 0.8 (0.88)