Download
1 / 22
220 likes | 394 Views
General Circulation of the Atmosphere René Garreaud www.dgf.uchile.cl/rene. General circulation of the Atmosphere.

E N D
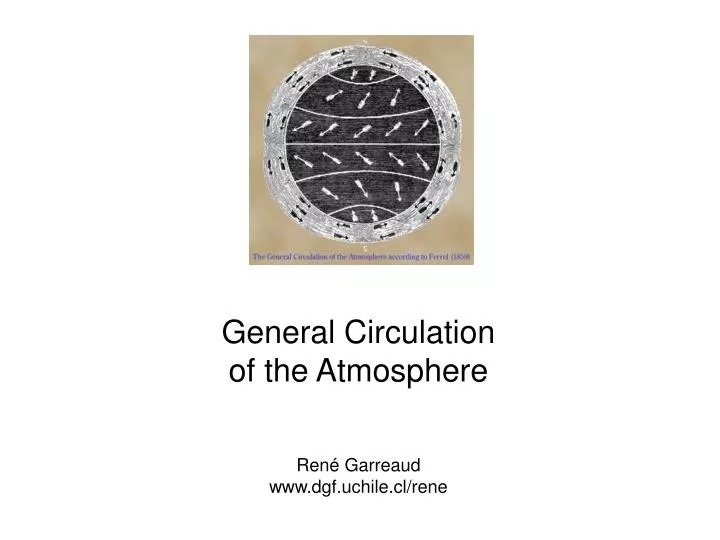
General Circulation of the Atmosphere René Garreaud www.dgf.uchile.cl/rene
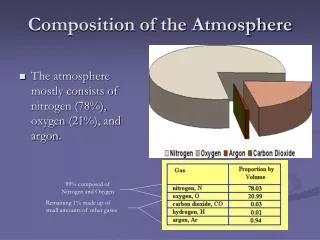
General circulation of the Atmosphere Low latitude areas receive more solar energy than high latitudes (because of earth sphericity). Low latitudes are also warmer, so they emit more infrared energy back to space (OLR ~ T4), but this effect doesn’t compensate excess of insolation. There is an radiative imbalance between low and high latitudes, that would produce an increase (decrease) of temperature at low (high) latitudes. Actually, thermal structure of the planet is nearly in steady state. There must be a net transport of energy to compensate the radiative imbalance.
General circulation of the Atmosphere Simple solution: Direct thermal cell t F C t+t F C
General circulation in an aqua-planet Perpetual Equinox Surface winds = 0 /100 = 0 = 2/24 hrs-1
General circulation in an aqua-planet Perpetual Equinox ITCZ: Intertropical Convergence Zone NE trades Tropical Tropopause (15 km) Belt of lower pressure 0° SE trades Belt of higher pressure Surface westerlies 45° Surface wind (arrows) Precipitation (green shadow)
General circulation in an aqua-planet Perpetual Equinox ITCZ 0° Jet stream (westerly flow) aloft (10-12 km): long term mean. Boundary between subtropical and extratropical air masses 60° Midlatitude precipitation maximum and westerly belt
General circulation in an aqua-planet Perpetual Equinox Z300: Meanders of the jet associated with development of troughs and ridges aloft Daily view of the jet stream: Highly unstable
General circulation in an aqua-planet Perpetual March or September Daily Z300 (colors) SLP (contours) Precipitation area (blue lines) H H L Acomplish poleward transport of heat and westerly momentum { Trough aloft → surface low Ridge aloft → surface high Produce midlatitude weather& precipitation
General circulation in an aqua-planet Perpetual March or September Schematics of poleward heat transport by transient eddies in midlatitudes
Real world general circulation Continents and seasonality Nice…we still have ITCZ, jet streams, midlatitude precipitation maximum, but with considerable zonal asimetry
Real world general circulation Continents and seasonality
Real world general circulation Continents and seasonality Ocean energy transport ~0.3 total transport
Real world general circulation Continents and seasonality
Real world general circulation Continents and seasonality Jan J WB SAPF In austral summer, weak convection takes place in the SH low latitudes. There is moderate subsidence over the SH subtropics driving a weak jet stream at about 45°S. The upper-level jet stream is, however, over the SAPF producing a rapid growth of the eddies that force strong westerlies near the surface.
Real world general circulation Continents and seasonality Jul JSP JST WB SAPF In austral winter, strong convection takes place in the NH low latitudes, fostering strong subsidence over the SH subtropics and driving an intense jet stream at about 30°S. The subpolar jet stream and westerly belt at about 45°S tends to weaken but they are still there because of the baroclinicity around the SAPF.
July Jan Real world general circulation Continents and seasonality Long term mean rainfall (colors) & surface winds (arrows) * NH bias in east Pacific ITCZ position * Higher tropical precipitation in July compared with January (SST) * South American monsoon (austral summer precipitation) * Subtropical anticyclone stronger in winter.
Real world general circulation Surface wind (contours) & 300 hPa wind (colors) Jan Jul Westerlies JST JST+SP (Surface) Westerly belt is more continuous and stronger in austral summer than in winter. Stronger westerlies at surface not always under strong westerlies aloft....
Real world general circulation Surface wind (colors) & Sea Surface Temperature (contours) Jul Jan Note that maximum westerlies tend to coincide with SST maximum gradient (APFZ). Implication for ice ages…
Real world general circulation Surface wind (contours) & 300 hPa wind (colors) Jul Jan Storm Track Storm Track JST JST+SP Storm track: band of preferred displacement of transient disturbances. Usually quantified as 2(Z250). In principle, eddy growth rate [T]/y~ U300, but not always the storm track is under stronger westerlies
Real world general circulation Surface wind (contours) & precipitation (colors) Jul Jan Midlatitude precipitation tends to coincide with max. Usfc and storm track, but also depends of other factors, including tropical connection.
Upper tropospheric jet stream and surface depresions 30 day animation of 300 hPa zonal wind speed (shaded, 25 and 50 m/s) and 925 hPa relative vorticity (contours, -3 and -6 10-5 s-1). Time resolution is 6 hours
Corredores de tormentas (Varianza de vorticidad, viento zonal, precipitación) Anual Junio Enero