Download
1 / 49
490 likes | 588 Views
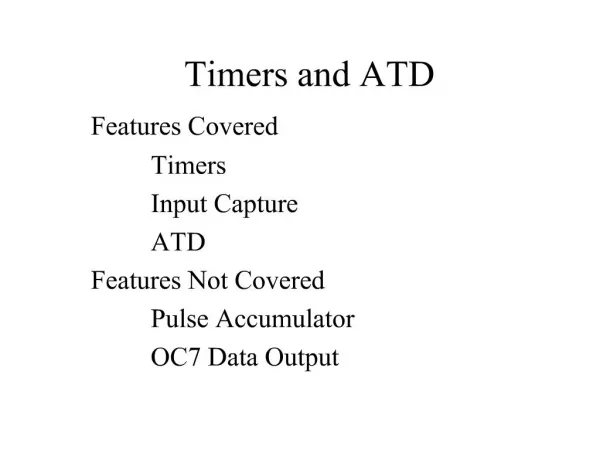
Using the Four Component Model at Tulsa Community College Ken Gonzalez and Mary Millikin February 9, 2009. 4 Components of AtD. What’s Wrong?. Success Rate with a “C” or Better. Intermediate Algebra……………. 45% Beginning Algebra………………. 49% Basic Math ..……………………… 63%

E N D
Using the Four Component Model atTulsa Community CollegeKen Gonzalez and Mary Millikin February 9, 2009
Success Rate with a “C” or Better Intermediate Algebra……………. 45% Beginning Algebra………………. 49% Basic Math ..……………………… 63% Writing II ..………………………… 61% Writing I…………………………… 65% Reading II…………………………. 64% Reading I …………………………. 64%
Developmental Course Summary • Females were significantly more successful in all developmental course work • African Americans who enrolled in Basic Math faced significantly greater challenge • No significant differences by age, degree type, or enrollment status • Most students who required remediation did not persist to College Algebra • Over half of students requiring writing remediation did persist to Freshman Comp I
Gatekeeper Course Success 1823 1251 974 1345 394
Gatekeeper Course Summary • 10 Gatekeeper courses were identified based on enrollment frequency and/or success rate • Female students were more successful in Freshman Comp I and II • African Americans, and more specifically African American males were most at risk
Percent C or Higher by Gender 2649 4499
Percent C or Better by Ethnicity 802 204 595 5103 266 176
Percent C or Better by Age 5213 766 482 459 228
Grade Summary • Females significantly more successful • African Americans are less likely to attain a “C” or higher • Male “C” or higher was 31% • Among non-traditional student, success increases as age increases • No difference was found between full-time and part-time students • UT students had a higher cumulative GPA (2.43) than WD students (2.26)
Persist or Graduate 1972 1485 989 968 781 717
Summary of Persistence • Females were significantly more likely to persist • African Americans were less likely to persist from Fall to Fall and from entry semester to last Spring semester • African American males were at highest risk for drop out • First semester persistence was 56% • Fall to Fall persistence was 25% • Students 21-24 years and 30-39 years were most likely to persist • Students with unidentified majors do not persist
Graduation Rate by Number of Developmental Areas Required 591 789 329 263
Graduation Rate by Reading Placement 1404 263 305
How did Quantitative Data lead Core Team to selecting priorities? • Data presented in October 2007 college-wide professional development day (approx. 1000 attended) • In November 2007 the 40-member Core Team representing four campuses: • Accompanied by AtD Coaches • Divided into tables of 8-10 • Reviewed data presented at college-wide professional development day • Held conversations and reported conclusions • Selected and ranked three top priorities
How did Quantitative Data lead Core Team to selecting priorities? • Persistence: To understand and address foundational affective success factors • Reading I & II: To understand and address foundational cognitive success factors • Developmental Math: To understand and address the courses with the poorest success rates • African American Males Success: To understand and address the greatest at-risk population at TCC
To determine the barriers to Persistence, we tapped expert knowledge fromstudents, faculty, and staff
Persistence Question: “What barriers and challenges did you experience your first semester at TCC?” Student Success Start Stop out or drop out
Focus Group Training for Facilitators • Selection of facilitators • Representative of four campuses • Representative of major academic areas • Demographics representation • Voluntary consent
Who did we get to facilitate? • Six faculty and staff from four sites • Faculty represented Liberal Arts, Allied Health, and Mathematics • Staff represented Student Affairs, Registrar, and Institutional Research • Five females and one male • Caucasian • All highly active, highly involved faculty and staff!
How were students recruited? • By other students • Student recruiters selected from Student Affairs work study students • Collaboration with Student Activities Offices • Recruiters drew for iPod Nano • Given packets of information • Targeted classes with highest 2nd semester freshmen • Provided with script • Provided with sign up sheets for as a promise to attend • Thank you pizza parties for SAOs
Students for Mock Focus Groups • How did we get them to attend? • Voluntarily attended • Were provided lunch or snacks, pop and chocolate • Provided with a $10 gas card for each attendee • Drawing for iPod Nano • Still low participation; walked learning lab and library • Students engaged well on topic once they arrived
Students for Actual Focus Groups • How did we get them to attend? • Voluntarily attended • Were provided lunch or snacks, pop and chocolates • Provided with a $10 gas card for each attendee • Drawing for 4 iPod Nanos, one for each campus • SAO issued reminder calls the day before • Sent auto voice mail message • Sent mass email • Sent reminder emails to targeted faculty • Had students introduce self and state semester in college
Lessons Learned: Importance of Planning & Logistics • Logistics: many intricate and critically timed details detailed planning important single coordinator with clerical staff essential • Support necessary from entire college • Timing and coordination important Academic calendar Room reservations Refreshment orders Paperwork for each group on site Incentives • Submitting complete documentation paperwork essential
Multi-campus Challenges • Campus identities, tradition • Facilitator/scribe coverage for all campuses • Travel and travel time • Developing a reliable working structure to administer on-site logistics and communicate through one designated office on each campus to the central coordinator • Gaining sufficient sample size from student participants at each campus to accurately measure campus differences • Sharing results explanation with each campus and with stakeholder groups
Lessons Learned: Facilitating • Train thoroughly. • Be prepared. • Clearly target the question accurately (must agree on one identical question wording and discussion focus among multiple facilitators). • Control focus group size. • Maintain security of focus group attendees’ identity and privacy of focus group during session. • Create friendly, open atmosphere before, during, and after each group. • Repeatedly redirect the discussion to the targeted question.
Lessons Learned: Facilitating • Provide encouraging verbal and nonverbal feedback without evaluating. • Be prepared for slow starts or silence for reflection at first; be patient. • Work to obtain clear “nugget” of information describing each barrier. • Capture “nugget” in students’ language. • Separate combination “nuggets” of information. • Echo understanding of “nugget” and receive confirmation. • Verbalize “nugget” for scribe. • Monitor time closely to cover high percentage barriers. End on time. • Enter data accurately when transcribing; use audio recording. • Clean data to isolate one clear “nugget” in each barrier.
Qualitative Data Analysis: Process • Personnel 6 facilitator/scribes trained 6 conducted/scribed groups 4 analyzed • Cleaned data • Sorted data into related barriers, clusters, families and analyzed • Derived list of top barriers by frequency of reporting
Qualitative Data Analysis:Summary Groups • 12 total focus groups of students, 3 groups each campus • 7 total faculty/staff focus groups, 1-2 groups each campus Participants • 101 students; 199 barriers named • 64 total faculty/staff (61% staff; 39% faculty)
Qualitative Data Analysis:Findings • Many barriers seemed related. • Data Team classified barriers into larger clusters or categories to provide the best overall picture of the data. • No single barrier was mentioned in every single focus group on all four campuses. • Many barriers occurred frequently and were identified on all four campuses. • Barriers specific to individual campuses did not occur frequently overall; College-wide barriers were identified far more frequently.
Qualitative Data Analysis:Top Persistence Barriers on All Campuses FROM STUDENTS • Adjusting to college • Balancing school, employment, and life • Textbook issues • Tulsa Achieves implementation issues • Communication issues with instructors • Choosing courses FROM FACULTY AND STAFF • Student attitudes/motivation • Students not academically prepared • Other classroom issues • General policy issues
Qualitative Data Reporting:Discussion of Data with Various Stakeholders • Verbal reports • PowerPoint presentations • Sorted data printouts • Meetings to explain barriers to stakeholders across college • External and internal websites • Stakeholders have validated that the barriers frequently appear among students they contact: Yes, that’s it exactly!
Intervention: Strategies for Academic Success • 3-hour credit orientation course (required of study cohort) • Planned by college-wide committee, representatives from all campuses • Common objectives used in all sections • Barriers addressed by the curriculum • Common formative assessment and summative assessment for course • Faculty training on all campuses • Staffing criteria
Top Persistence Barriers FROM STUDENTS • Adjusting to college • Balancing school, employment, and life • Textbook issues • Tulsa Achieves implementation issues • Communication issues with instructors • Choosing courses FROM FACULTY AND STAFF • Student attitudes/motivation • Students not academically prepared • Other classroom issues • General policy issues
Addressing Barriers: Strategies for Academic Success • Locate and apply college resources and support systems and use for school-related activities (MyTCC Email, Blackboard, Career Center, Advisement, Financial Aid, Learning Resource Center, Computer Labs, and Support Labs) [adjusting to college; not academically prepared; attitudes/motivation] • Define and effectively set goals to meet interests and values [attitudes/motivation; adjusting to college; balancing school and life;]
Addressing Barriers: Strategies for Academic Success • Construct and monitor weekly/ monthly time plans to balance work, school, family, and social activities [balancing school and life; attitudes/motivation] • Identify and apply reading strategies for successful reading of college texts for discussion and written assignments [not academically prepared; adjusting to college] • Identify and apply writing process strategies for successful creation of college-level papers [not academically prepared; adjusting to college]
Addressing Barriers: Strategies for Academic Success • Identify and apply strategies to resolve both academic and social conflicts and cope with stress [adjusting to college; balancing school and life; communication issues with instructors ; attitudes/motivation] • Analyze and modify study techniques based on assignment and assessed learning style: • Demonstrate effective note taking techniques across the disciplines; • Demonstrate test taking strategies for objective tests, essay exams, and oral examinations; • Use techniques for improving memory and concentration; [not academically prepared; attitudes/motivation]
Addressing Barriers: Strategies for Academic Success • Choose a major, create a semester schedule, and establish a career development plan [choosing courses; attitudes/motivation] • Demonstrate transference of skills learned to other course work during the semester.
Formative Assessment: Strategies for Academic Success • Tools Integral part of course planning from beginning LASSI (pre-test 3rd week; post-test 13th week) Course in Reflection (common rubric) • Use Formative results will be used by faculty to determine adjustments in curriculum to address barriers even better
Assessment Next Steps : Strategies for Academic Success • Analyze formative assessment data LASSI pre- and post-test results “Course in Reflection” common summative course assessment for fall 2008 and spring 2009 Strategies faculty focus group data collected. Provide results to Strategies faculty. • Adjust curriculum • Summative assessment of persistence data
Value of Focus Groups at TCC • Answer the “Why?” question. • Link intervention planning and resources to data. We clearly know what needs to be addressed, and we construct interventions to address those needs. • Provide practical approach to effectively involve a range of students, faculty, and staff across all campuses. • Foster collaboration of new clusters of faculty and staff • Increase shared governance • Emphasize shared barriers/issues and ONE COLLEGE