Download
1 / 45
450 likes | 559 Views
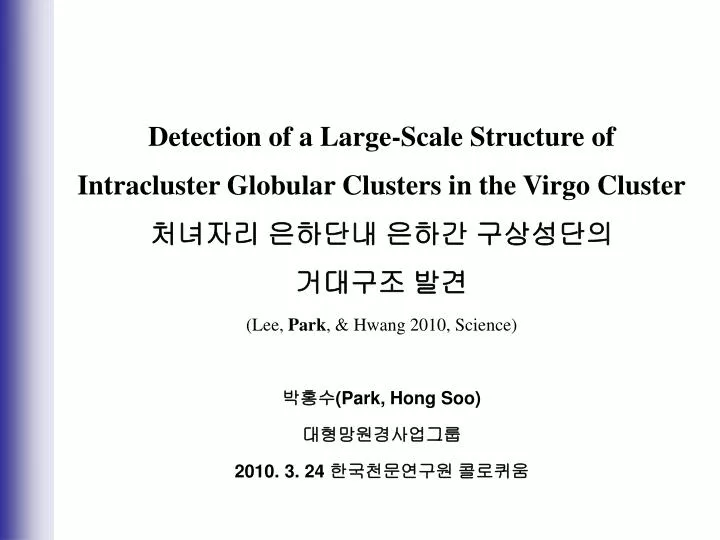
Detection of a Large-Scale Structure of Intracluster Globular Clusters in the Virgo Cluster 처녀자리 은하단내 은하간 구상성단의 거대구조 발견 (Lee, Park , & Hwang 2010, Science) 박홍수 (Park, Hong Soo) 대형망원경사업그룹 2010. 3. 24 한국천문연구원 콜로퀴움. Contents 1. Introduction 1.1 Properties of GCs

E N D
Detection of a Large-Scale Structure of Intracluster Globular Clusters in the Virgo Cluster 처녀자리 은하단내 은하간 구상성단의 거대구조 발견 (Lee, Park, & Hwang 2010, Science) 박홍수(Park, Hong Soo) 대형망원경사업그룹 2010. 3. 24 한국천문연구원 콜로퀴움
Contents 1. Introduction 1.1 Properties of GCs 1.2 Intracluster Objects 1.3 Previous Studies of IGCs 1.4 Limits of Study of Virgo IGCs 2. Virgo Intracluster GCs 2.1 Data 2.2 Method 2.3 Density Map 2.4 Radial Profile 2.5 Discussion and Implication 3. Summary and Future Work
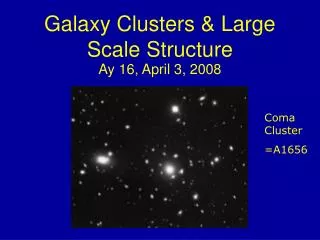
Globular Clusters in the Virgo cluster ? M49, Virgo gE M13, MW GC
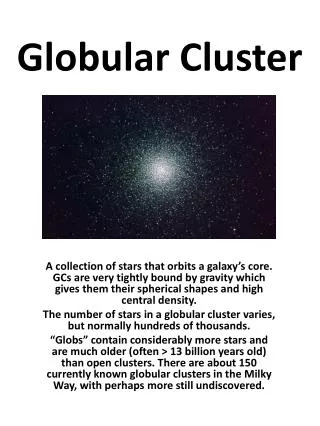
Properties of Globular Clusters GCs in our Galaxy The number of GCs = 150 (Harris 2003) Spatial distribution
Properties of Globular Clusters Color distribution of Galactic GCs Metal Poor Metal Rich
Properties of Globular Clusters Color distribution of GCs in gEs Blue GCsRed GCs Metal Poor Metal Rich M87 Larsen et al.(2001)
Properties of Globular Clusters M87 Luminosity function - Turn over magnitude - Mv(TOM) =-7.4 mag, width~1.6 Galactic GCs M87 by Peng et al. (2009)
Properties of Globular Clusters Radial number density profile Blue GCs Red GCs (Stellar light) NGC 1399 by Brodie & Strader (2006)
Properties of Globular Clusters Stellar light Spatial distribution Blue GCs : circular shape Red GCs : stellar light NGC 4636 by Park et al. (2010) Blue GCsRed GCs
Intracluster Objects Zwicky (1951), van den Bergh (1956) : There may exist stars and interstellar medium between galaxies in clusters of galaxies. Intracluster Objects : They are gravitationally controlled by the potential of the galaxy cluster itself. ex) diffuse optical stellar light, planetary nebulae, resolved red giant stars, diffuse hot X-ray emitting gas
Intracluster Objects Stellar Light : Mihos et al. (2005) : Virgo Cluster center. 0.6 m Burrell Schmidt Telescope. ~1.5x1.5deg : M,V filter. several long tidal streamers, a myriad of smaller scale tidal tails and bridges between galaxies.
Intracluster Objects Planetary Nebulae (PN) Feldmeier et al. (2004) Intracluster PN in the Virgo cluster. KPNO-4m. PN luminosity density.
Intracluster Objects Red Giant Stars Durrell et al.(2002) HST/WFPC2 Total(F814W)=33,800sec an excess of a population of intracluster red giant branch (RGB) stars
Intracluster Objects X-ray gas Bohringer et al. (1994) ROSAT 12x12 deg Showing hot luminous gas extending over most of the optically visible cluster. Showing that a large part of the mass of the cluster is centered on the galaxy M87.
Previous Studies of Intracluster GCs White III (1987), Muzzio (1987), West et al.(1995) Globular clusters should be stripped off from galaxies in a galaxy cluster and that there should be a cluster-wide population of intracluster globular clusters (IGCs) in galaxy clusters.
Previous Studies of Intracluster GCs Marin-Franch et al. (2003) Coma cluster 2.5 m Isaac Newton Telescope (INT). Using surface brightness fluctuation technique intracluster GCs do not exist in Coma. Jordan et al. (2003) Abell 1185 HST/WFPC2 The point source excess is likely due to the presence of GCs.
Previous Studies of Intracluster GCs Tamura et al. (2006) Wide-field imaging survey of GC populations around M87 with Suprime-Cam on the 8.2m Subaru Telescope. 2x0.5 deg field extending from the centre of M87out to a radius of ∼0.5 Mpc.
Previous Studies of Intracluster GCs Williams et al. (2007) HST/ACS (I=26,880sec, V=63,440sec) discovery of 4 candidate IGCs in the Virgo cluster
Study of Intracluster GCs It is not yet known whether this cluster-wide population of IGCs exists in any galaxy cluster or not because of shallow photometric limits or small area coverage. The Virgo cluster is the best target to search for a cluster-wide population of IGCs, because it is the nearest massive galaxy cluster.
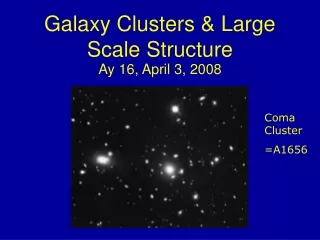
Virgo Galaxy Cluster Distance=16.5 Mpc (m-M)=31 Field of view : 12x18 deg The GCs in the Virgo cluster are showed point sources through ground based telescopes . Binggeli et al.(1985) Virgo Cluster Catalog (VCC) N=2096
Study of Intracluster GCs Because of its largest angular extent and the faintness of its globular clusters it has been difficult to find and study IGCs over the entire Virgo cluster. The Sloan Digital Sky Survey
Data SDSS(The Sloan Digital Sky Survey) Photometric(ugriz) and spectroscopic survey. 2.5m telescope at Apache Point Observatory, New Mexico 1.5 square degrees of sky at a time The newest data catalog : DR7 Legacy DR7 Imaging Sky Coverage (one-quarter of the entire sky) Point source catalog in SDSS/DR6 Deep enough to study the bright GCs in Virgo. Wide enough to cover the entire Virgo cluster.
Data Hint to detect GCs in the Virgo cluster. Color-Magnitude Diagram (CMD) of GCs in 10 gEs and 10 control fields. Selection criteria for GC candidates. 0.6 < (g-i)0 < 1.3 19.5 < i0 < 21.7 -2.0<[Fe/H]<0.4 using the GCs known the radial velocity.
Surface number density map of the Virgo GCs 12x18 deg
Method Contamination by background or foreground sources foreground stars disk and halo of our Galaxy Point sources Virgo overdensity unresolved background galaxies not available of conventional method (target field-control field) Color-Magnitude Diagram(CMD) Method
Method Virgo overdensity (tidal stream or low-surface brightness dwarf galaxy) Juric et al. (2008)
Method CMD to make density map Selecting CMD regions for the foreground stars
Method Net GC density map = raw GC map – Foreground Star map FS map =bright star map + faint star map
Density Map GCs in the Virgo cluster Diffuse large scale distribution of GCs Several strong concentrations Large size substructure Tidal feature: elingated structure, bridgelike feature
Density Map GCs vs. X-ray - similar to large scale x-ray emission. (ROSAT all-sky survey) - not similar to the west of M87 the north of M87.
Density Map GCs vs. early-type galaxies(E+S0+dE) and late-type galaxies (S+SB+Irr)
Density Map Spatial distribution of Blue GCs and Red GCs BGCs are more extended than that of RGCs. IGCs are probably dominated by Blue GCs. (stripped from dEs) - Blue GCs 0.6 < (g−i)0 ≤ 0.95 Red GCs 0.95 < (g−i)0 < 1.3
Radial profile Radial density profile after masking all galaxies with R<5R25 Change in the slope at R=40 arcmin (similar to edge of the stellar halo of M87, Doherty et al 2009) GCs at R>40 arcmin may be mostly IGCs.
Radial profile Similar to the slope of dE profile. Consistent with the slope from numerical simulations (Bekki et al. 2006). The IGCs may follow the dark matter distribution of the Virgo cluster.
Radial profile The density of the blue GCs is about twice as large as that of the red GCs for 40 arcmin < R < 6 deg The IGCs may be dominated by the blue GCs.
Radial profile Radial density profile of the GCs inside masked galaxies Slope is flat following the host galaxy potential
The Number of IGCs M87 Total number of IGCs N(IGC, 40’<R<6deg) = 1,500 N(IGC corrected ) > 12,000 N(GC in galaxies) = 3,200 N(total Virgo GCs) > 36,000 M87 by Peng et al. (2009)
Origin of IGCs There is a wide distribution of IGCs and they are mostly blue (metal poor). The major origin of these IGCs is low-mass dwarf galaxies. Mixture scenario for the origin of GCs in gEs (Lee, Park, et al. 2010) : Metal-poor GCs were formed mostly in low-mass dwarf galaxies. Metal-rich GCs were formed later with stars in massive galaxies or in dissipational merging galaxies. Elliptical galaxies grow via dissipational or dissipationless merging of galaxies and via accretion of many dwarf galaxies. IGCs in Virgo might have been stripped off from low-mass dwarf galaxies and are now being accreted locally to nearby massive galaxies, and globally to the center of Virgo.
Implication Critical role in understanding how galaxies and galaxy clusters form and evolve. If we get the radial velocity of the IGC candidates, we can investigate the detailed distribution of dark matter in galaxy clusters, the dynamical evolution of galaxy clusters, and the origin of the intracluster matter, with the help of theoretical modeling. If we get their ages and metallicity either from the spectroscopy or from the high resolution imaging, we can explore the origin of globular clusters, and the formation of the first stars in the universe.
Virgo cluster M49, Virgo gE M13, MW GC
Ongoing Work Next Generation Virgo Cluster Survey (NGVS) using CFHT/Megacam ugriz filter
Future Work To confirm of real IGCs Deep imaging of GCs candidates : HST, GMT Radial velocity of GC spectroscopy : 4m telescopes Chemical properties of IGCs : Age and Metallcity CMD from deep images Spectra from spectroscopic observation : 8-10m telescopes, GMT