Download
1 / 34
360 likes | 621 Views
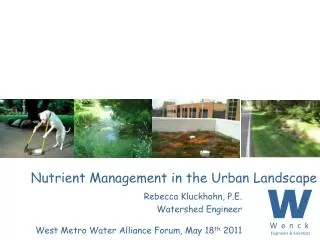
Nutrient management in the food chain of China. Fusuo Zhang Lin Ma. China Agricultural University. Feb. 25 ,2014, Beijing, China-UK Workshop on Nutrient Management and Water Resource Protection. Outline. Problems and challenges N utrient flow in the food chain

E N D
Nutrient management in the food chain of China Fusuo Zhang Lin Ma China Agricultural University Feb. 25 ,2014, Beijing, China-UK Workshop on Nutrient Management and Water Resource Protection
Outline • Problems and challenges • Nutrient flow in the food chain • Strategies of nutrient management
Food security issue of China is always a global concern Lester Brown
It took several hundred years to realize the dream of food sufficiency in China Population (M) Grain demand and production (M ton) Year (Data from the Statistic Bureau of China; Demand was estimated by using average grain demand of 400 kg/capita/yr)
Grain production and resources input Grain yield in China has been merely secured by much higher input of resources including fertilizer, irrigation, plastic film and pesticides. (National bureau of statistics of China, 1961-2010; Zhang et al., 2011)
130 Yield response curve 500 China 110 Relative yield(%) 300 90 GHGI(kg CO2 eq Mg-1) Developed countries 200 70 Africa 30 300 0 50 100 150 200 250 350 Environment impact by N loss 100 50 0 N rate (kg N ha-1)
NATURE(Liu et al., 2013) Air pollution Bulk N deposition has increased from 13 kg N ha-1 in 1980s to 21 kg N ha-1 in 2000s, among which agricultural Nr sources occupied ~2/3.
Soil acidification Soil pH was decreased by 0.5 units due to overuse of N fertilizers. -0.5
(China State Oceanic Administration, 2009) Eutrophication China’s eutrophied lake area reached 8700 km2 (2007) over the last 4 decades. (Science 2009, 1014-1015) (Jin, 2009)
Outline Food security and fertilizer application • Nutrient flow in the food chain Strategies of nutrient management
Nutrient management in the food chain Ma Lin’s thesis
N fertilizer input is 1.7 fold of crop uptake • Total N input is 2.4 fold of crop uptake 2.4fold 1.7fold N input and crop uptake in Chinese crop land in 1961-2009 (张卫峰等,2013 ) Calculated by using NUFE model (Ma et al.,2010) and FAO data base www.fao.org
“Better Life” in China- rapid growth of animal food, fruits and vegetables 1961 1989 2010 The percentage of plant protein and animal protein (Ma et al., 2013, Data source: FAO)
Booming development of animal husbandry in China in the past 30 years Poultry numbers Pig, meat cow, sheep and goat, milk cow numbers Year (the Statistic Bureau of China)
Des-coupling of crop and animal production ( Wang et al., 2010)
Food security (Ma et al., 2010) Quantify nutrient flow in the food chain by a new model NUFER (NUtrient flows in Food chains, Environment and Resources use) N2, NH3, N2O Atmosphere Environmental Sustainability Human consumption Food processing Exports and losses Animal production imports Resource use efficiency Crop production (soil accumulation) Erosion and runoff N P Surface waters Leaching Groundwater
3.1 21 High N fluxes in the food chain of China Unit: Million tonne (Mt) (Hou et al., 2013) 1980 1990 2000 2010 Air 8.6 + 5.7 Air 14.3 + 8.1 Air 22.4 +1.7 Air 24.1 House- Hold 2.8 House- Hold 5.0 House- Hold 4.1 + 0.9 House- Hold 3.5 + 0.6 + 0.7 3.3 3.5 2.8 0.8 0.9 2.3 1.5 0.5 0.17 0.18 0.15 0.14 Animal Production 7.4 Animal Production 18.1 + 3.1 Animal Production 21.0 Animal Production 11.0 + 3.6 + 8.1 7.5 3.8 5.5 1.3 1.1 2.0 1.3 1.1 + 5.6 Crop Production 46.1 + 11.5 + 11.6 Crop Production 40.5 Crop Production 17.3 Crop Production 28.9 + 2.8 + 5.6 +3.5 Water 15.2 Water 3.3 Water 6.1 Water 11.7
Contribution of N losses from different systems To water bodies To atmosphere
3.1 21 High P fluxes in the food chain of China Unit: Million tonne (Mt) 1980 1990 2000 2010 House- Hold 0.37 House- Hold 0.46 House- Hold 0.54 House- Hold 0.62 + 0.08 + 0.08 + 0.09 0.08 0.13 0.47 0.40 0.06 0.46 0.33 0.04 0.02 0.02 0.02 0.02 Animal Production 1.1 Animal Production 2.1 Animal Production 4.0 + 1.0 + 1.9 + 0.5 Animal Production 4.5 0.9 1.2 1.6 0.18 0.4 0.17 0.15 0.14 + 2.1 + 2.5 + 1.4 Crop Production 2.3 Crop Production 4.4 Crop Production 6.9 Crop Production 8.3 + 0.37 +1.25 +0.85 Water 2.83 Water 0.36 Water 0.73 Water 1.98
Contribution of P losses from different systems To water bodies
N and P losses of China in 2005 and EU in 2000(kg N ha-1) (Velthof et al., 2009; Ma et al., 2010) * No data
NUE and PUE in China Note: NUE= (O Main product / I Total)*100 (Smil, 2002; Howarth et al., 2003; Van der Hoek, 1998; Galloway, 2002; Liu et al., 2009; Schroder et al., 2010)
The 3rd step Yield increase 30%-50% The 2nd step Yield increase10%-20% (High-yield) Increase soil fertility Three-Step Strategy to increase crop yield and nutrient use efficiency at the same time - For ensure both food security and environment quality simultaneously Crop productivity The 1st step Saving N by 30% without yield penalty (saving fertilizer) At present Water and nutrient input
2009 (First step) Cut down N fertilizer by 30-50% reduces N loss into environment greatly without diminishing crop yield!
----Increase yield and NUE by 30-50% (Third step) Mean maize grain yield and modeled yield potential, N balance (fertilizer inputs-harvest outputs) and N applied per unit of grain produced for different management systems: integrated crop and soil system management approach (ISSM, n=66), farmers’ practice (FP, n=4548), and high-input, high-yielding studies (HY, n=43). (Chen et al., PNAS, 2011)
Three-Step Strategy to increase animal productivity and decrease nutrient losses at the same time
Nutrient management in food chain 2 Three-Step Strategy in crop production Decrease demand 1 Optimize diets Fertilizer industry 3 Recycle wastes Decrease pressure Decrease losses Environment 2 Three-Step Strategy in animal production
N and P cost in the food chain in China (Ma et al., 2014)
Thanks for your attention ! Acknowledgments NSFC, MoA , MoE, MOST