Download
1 / 43
430 likes | 701 Views
LMO & Jackknife. Leave-many-out (LMO) validation:. An internal validation procedure, like LOO. LMO employs smaller training set than LOO and can be repeated many more times due to possibility of large combinations in leave many compounds out from training set.

E N D
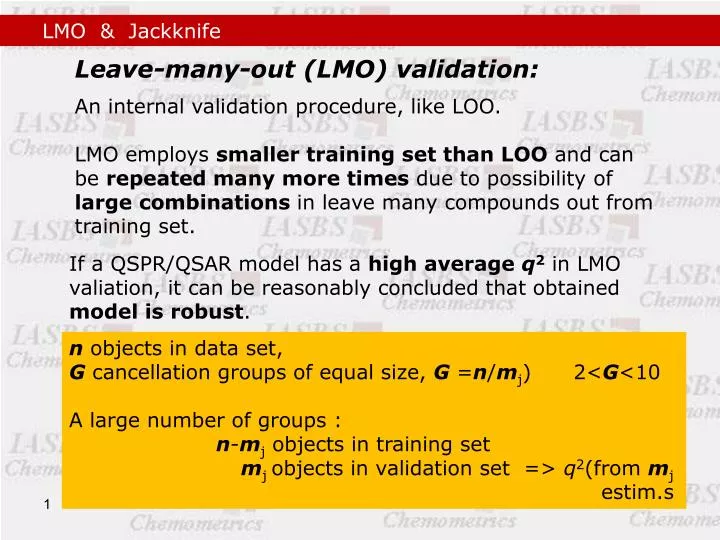
LMO & Jackknife Leave-many-out (LMO) validation: An internal validation procedure, like LOO. LMO employs smaller training set than LOO and can be repeated many more times due to possibility of large combinations in leave many compounds out from training set. If a QSPR/QSAR model has a high average q2in LMO valiation, it can be reasonably concluded that obtained model is robust. n objects in data set, G cancellation groups of equal size, G =n/mj) 2<G<10 A large number of groups : n-mj objects in training set mj objects in validation set => q2(from mj estim.s
LMO & Jackknife Jackknife: training set → a #Subsamples, SubSampNo>G each SubSample → SubTrain and SubValid +SubSampNo times estimation of parameters. (instead of time consuming repetition of the experiment) Along with LMO cross validation (internal validation)
LMO & Jackknife LMO SubTrain1 SubValid1 n=6 m=2 G=3 SubTrain4 SubValid4 …. # subsamples >> # molec.s in training set q2TOT
LMO & Jackknife Jackknife b1 SubTrain1 b2 n=6 m=2 G=3 b3 b4 SubTrain4 …. bsn # subsamples >> # molec.s in training set
LMO & Jackknife >> for i=1:subSampNo PERMUT(i,:)=randperm(Dr); end for i=1:9 % 9 Subsamples PERMUT(i,:)=randperm(6); % 6 molecules in train end PERMUT = 6 5 2 4 3 1 1 6 3 5 2 4 5 2 6 4 3 1 5 4 2 1 6 3 5 4 1 6 2 3 2 6 5 1 3 4 1 2 6 5 3 4 6 2 1 5 4 3 4 5 1 6 3 2 SubValid SubTrain
LMO & Jackknife SubTrain sets: SubValid sets: 6 5 2 4 → b1 3 1 → q21 1 6 3 5 → b2 2 4 → q22 5 2 6 4 → b3 3 1 → q23 5 4 2 1 → b4 6 3 → q24 5 4 1 6 → b5 2 3 → q25 2 6 5 1 → b6 3 4 → q26 1 2 6 5 → b7 3 4 → q27 6 2 1 5 → b8 4 3 → q28 4 5 1 6 → b9 3 2 → q29 histogr Db=y b=D+ y q2TOT
LMO & Jackknife 6 5 2 4 → b1 1 6 3 5 → b2 5 2 6 4 → b3 5 4 2 1 → b4 5 4 1 6 → b5 2 6 5 1 → b6 1 2 6 5 → b7 6 2 1 5 → b8 4 5 1 6 → b9 Distribution of b for 3rd Descriptor
LMO & Jackknife Jackknife: on all 31 molec.s and all 53 desc.s 200 subsamples(using MLR) Desc No 15 Desc No 25
LMO & Jackknife Jackknife: on all 31 samples and all 53 desc.s ( using MLR) Desc No 15 >> histfit(bJACK(:,15),20); Desc No 25
How much is the probability that 0.0 is different from the population by chance. To determine the probability: All data in population, and 0.0, should be standardized to z.
>> disttool Probability that 1.5 is different from μ by chance z = -1.5
>> disttool >>cdf Gives the area before z, from left. 0.0668 x2 =0.134 =p 2 tailed • Probability that difference between -1.5 and μ is because of random error is not < 0.05 (p>0.05) • -1.5 is not significantly different from population • p< 0.05 => signif. difference
LMO & Jackknife All descriptors, MLR q2TOT = -407.46 # signifdescrip.s =0 # p<0.05 =0
LMO & Jackknife All descriptors, PLS, lv=14 q2TOT = -0.0988 # p<0.05 =28 # signifdescrip.s =28
LMO & Jackknife All descriptors, PLS, lv=14 q2TOT = -0.0988 Significant descriptors with p<0.05 can be sorted (according to p value), For doing a forward selection --------------------------------- Desc No p --------------------------------- 51 1.4002e-022 37 1.383e-010 35 8.605e-009 38 9.1021e-009 39 1.8559e-008 36 8.7005e-008 15 0.00027689 1 0.00038808 2 0.00040547 45 0.00059674 32 0.00063731 # p<0.05 =28
LMO & Jackknife • q2TOT at different number of latent variables in PLS • (applying all descriptors) • 4 times running the program • lv • -.0411 .0776 -.0431 .0270 • .2200 .2340 .3641 .2576 • .1721 .1147 .2391 .1434 37 signif var • .2855 .1948 .0667 .2372 • .1847 .1275 .2390 .2184 • -.0343 -.1439 .0120 .0049 • 14 -.2578 -.2460 -.3010 -.0989 28 signif var Overfitt Inform ↓
LMO & Jackknife for lv=6:13 % Number of latent var.s in PLS for i=lv:18 [p,Z,q2TOTbox(lv,i),q2, bJACK]=… jackknife(D(:,SRTDpDESC(1:i,1)), y, 150, 27,2,lv); end end q2TOT Max q2TOT at lv=7 and #desc=7 No of descriptors lv
LMO & Jackknife D=Dini(:,[38 50 3]); [q2, bJACK]=jackknife(D, y, 500, 27) Three significant descriptors with q2 < 0.05, as example.
LMO & Jackknife function [p,Z,q2TOTbox(lv,i),q2, bJACK]=… jackknife(D(:,[34 38 45 51]), y, 150, 27,2,7); [34 38 45 51]: Selected descriptors 150: #subset samples in Jackknife 27: #samples in training set of each subset 2: calibration method (1, MLR; 2, PLS) 7: Number of latent variables in PLS Jackknife is a method for determining the significant descriptors beside LMO CV, as internal validation …. and can be applied for descriptor selection...
Exercise: Applying Jackknife of selected set of descriptors, using MLR and determining the results and significance of descriptors…
CMV Cross model validation (CMV) Anderssen, et al Reducing over-optimism in variable selection by cross model validation, ChemomIntell Lab Syst(2006) 84, 69-74. Gidskehaug, et al Cross model validation and optimization of bilinear regression models, ChemomIntell Lab Syst(2008) 93, 1-10. Validation during variable selection, and not posterior to it. Data set → a # train, and Test sets. train→ SubSample → SubTrain and SubValid
CMV Train Test PLS model ( b1 ) predic n=15 m=3 G=3 -Selec Var.s - # latent var.s Jackknife Test set: No contribution to var and lv sel process q2CMV1 q2CMV2
CMV . . . . . . q2CMVm Effective external validation
CMV function [q2TOT,q2CMV]=crossmv(trainD,trainy,testD,testy,selVAR,7) selVAR: set of selected descriptors (applied calibration method is PLS) 7: Number of latent variables in PLS CMV is an effective external validation method ...
Bootstrapping Bootstrapping: Bootstrap re-sampling, another approach to internal validation Wehrens, et al The Bootstrap: a tutorial, ChemomIntell Lab Syst(2002) 54, 35-52. There is only one data set. Data set should be representative of the population from which it was drawn. Bootstr. is simulation of random selection Generation of Kgroups of size n, by a repeated random selection of n objects from original data set.
Bootstrapping Some of the objects can be included in the same random sample several times, while other objects will never be selected. The model obtained on the n randomly selected objects is used to predict the target properties for the excluded sample. + q2 estimation, as in LMO.
Bootstrapping for i=1:10 %No of subSamples in bootstr for j=1:6 %Dr=6 number of molec.s in Train RND=randperm(6); bootSamp(i,j)=RND(1); end end bootSamp = 5 5 6 3 6 1 → b1 2 4 → q21 4 2 6 3 2 6 .. 1 5 .. 2 5 3 1 2 4 6 2 3 1 4 4 1 5 6 3 3 2 6 3 3 1 4 5 5 5 6 4 4 3 1 2 4 3 6 1 1 2 5 2 2 5 4 5 1 3 6 3 3 2 3 3 5 1 4 6 2 3 1 6 4 6 → b10 5 → q210 SubTrain SubValid Same no of molec as Train Not present in SubTrain
Bootstrapping 50 38 15
Bootstrapping Sorted Distribution of b values are not normal signif Nonparam estimation Of confidence limits Not signif signif 200 subsamples, 200x0.025=5 => 5th from left and 5th from right are the 95% confidence limits.
Bootstrapping 50 38 15 -12e-5 0.1113 -0.0181 -1.5e-5 0.5131 0.0250 Small effect But signif Not signif
Bootstrapping function [bBOOT]=bootstrp(trainD, trainy,1000,2,7) 1000: #subset samples in bootstrapping (#molecules in SubTraining set = #molec.s in Train) 2: calibration method (1, MLR; 2, PLS) 7: Number of latent variables in PLS Bootstrap is a method for determining the confidence interval for descriptors...
Model validation Y-randomization: Random shuffling of dependent variable vector, and development of a new QSAR model using original dependent variable matrix. Repeating the process a number of times, Expected: QSAR models with low R2 and LOO q2 values chance correlation or structural redundancy of training set Sometimes: High q2 values Acceptable model can not be obtained by this method.
Training and test External validation: Selecting training and test sets: a. Finding new experimental tested set: not a simple task b. Splitting data set into training and test set. For establishing QSAR model For external validation Both training and test sets should separately span the whole descriptor space occupied by the entire data set. Ideally, each member of test set should be close to one point in training set.
Training and test Approaches for creating training and test sets: 1. Straightforward random selection Yasri, et al Toward an optimal procedure for variable selection and QSAR model building, J ChemInfComputSci(2001) 41, 1218-1227. 2. Activity sampling Kauffman, et al QSAR and k-nearest neighbor classification analysis of selective cyclooxygenase-2 inhibitors using topologically based numerical descriptors, J ChemInfComputSci(2001) 41, 1553-1560. Mattioni, et al Development of Q. S.-A. R. and classification models for a set of carbonic anhydrase inhibitors, J ChemInfComputSci(2002) 42, 94-102.
Training and test 3. Systematic clustering techniques Burden, et al Use of automatic relevance determination in QSAR studies using Bayesian neural networks, J ChemInfComputSci(2000) 40, 1423-1430. Snarey, et al Comparison of algorithms for dissimilarity-based compound selection, J Mol Graph Model (1997) 15, 372-385. 4. Self organizing maps (SOMs) Gramatica, et al QSAR study on the tropospheric degradation of organic compounds, Chemosphere (1999) 38, 1371-1378. Better than random selection
Training and test Columns (molecules) as input for Kohonen map: selwood data matrix 19, 18 3,20 53 × 31 Kohonen Map 4, 23,14 15,16 Sampling from all region of columns (molecules) space
Training and test ! 15 Correlation With activity
Training and test 5. Kennard Stone Kennard, et al Computer aided design of experiments, Technometrics(1969) 11, 137-148. Bourguignon, et al Optimization in irregularly shaped regions- pH and solvent strength in reverse-phase HPLC separation, Anal Chem(1994) 66, 893-904. 6. Factorial and D-optimal design Eriksson, et al Multivariate design and modeling in QSAR. Tutorial, ChemometrIntell Lab Syst(1996) 34, 1-19. Mitchell, et al Algorithm for the construction of “D-optimal” experimental designs, Technometrics(2000) 42, 48-54.
Training and test D-optimal Gramatica, et al QSAR modeling of bioconcentration factors by theoretical molecular descriptors, Quant Struct-Act Relat(2003) 22, 374-385. Selection of samples that maximize the |X’X| determinant. X: Variance-covariance (information) matrix of independent variables (desriptors) or independent plus dependent variables. These samples will be spanned across the whole area occupied by representative points and constitute the training set. The points not selected are used as test set. => well-balanced structural diversity and representativity of entire data space(descriptors and responses)
Training and test trianD1 = [D(1:3:end,:);[D(2:3:end,:)]]; trianD2 = D([1:2 5:13 17 21 22 25:end],:); Optimum selection of descriptors and molecules in training set can be performed using detCovDy (D-optimal
leverage Model applicability domain No matter how robust, significant and validated a QSAR maybe, it cannot be expected to reliably predict the modeled property for the entire universe of chemicals.!! Leverage is a criterion for determining the applicability domain of the model for a query compound: x: vector of query compound X: Matrix of training set indep variables
leverage Using all descriptors leverage for all test samples are very high. It means that test samples are not in the space of training samples and can not be predicted.
leverage 38 50 3 13 24 Using a number of descriptors (38 50 3 13 24)leverage for test samples are similar to training samples. It means that test samples are in the space of training samples and can be predicted.