Download
1 / 29
290 likes | 351 Views
Presentation available online at independentbeveragegroup.com. Volume. Moving Forward Industry volume will be down (- 1.0% through 2020). ABI and MC will each be down. All Others will be up. ABI & MC vs. All Others Forecast. All Others.

E N D
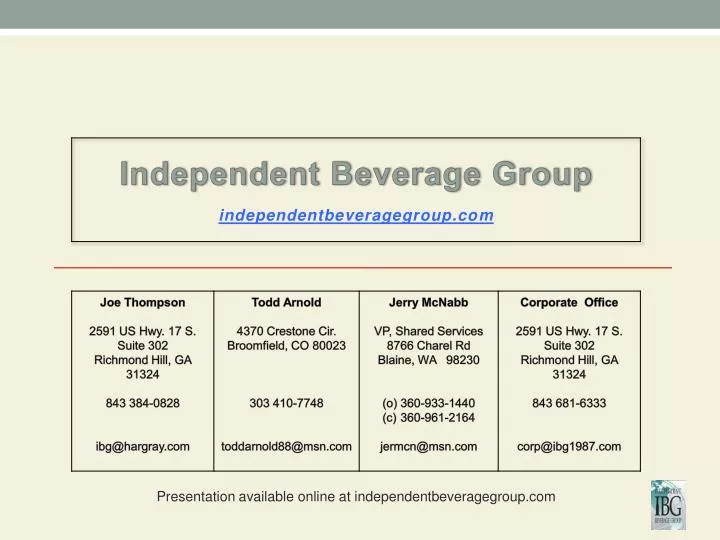
Presentation available online at independentbeveragegroup.com
Volume • Moving Forward • Industry volume will be down (-1.0% through 2020). • ABI and MC will each be down. • All Others will be up.
ABI & MC vs. All Others Forecast All Others Assumes overall industry will be down 1.0% during each of the forecast years.
% of Absolute Alcohol Beer Spirits Wine Distilled Spirits Council
Distributors Declining – Craft Brewers Increasing 3,200 Brewers 2020 ??????????? 42 • IBG estimates: • 2010 – 950 = 90% of volume. • 2020 – 650 = 85% of industry volume. • Self distribution, sort drink, specialty = 1,000 – 2,500.
Beer Brands by Segment -TUS Multi Outlet + Convenience • As of mid-year, craft brands and cider brands have already surpassed their numbers in 2013 (based on brands selling more than 1 case). Total Brands 4,948 Total Brands 4,975 Total Brands 4,577 Total Brands 4,031 Source: Bump Williams Consulting
Beer SKUs by Segment 2010-2013 • TUS Multi Outlet + Convenience + RMA Sum of Total Liquor Stores • The net number of beer SKUs increased by 4,031 or 62.8% over these four years (based on SKUs selling more than 1 case). Total SKUs 9,447 Total SKUs 8,287 Total SKUs 7,256 Total SKUs 5,416 Source: Bump Williams Consulting
Avg Items Carried Per Store - 2008 – 2012 Time Series by Channel 2008 – 2012 Increase In Avg Item Per Store 224 or +22% Avg. Items Per Store 1,234 Avg. Items Per Store 1,202 Avg. Items Per Store 1,124 Avg. Items Per Store 1,080 Avg. Items Per Store 1,010 Source: Bump Williams Consulting
Volume • Distributors and retailers are very focused on above premium category. • Industry is losing heavy beer drinkers due to aggressive pricing. Millennials enjoy craft, FMB’s and cider and drink less than past consumers. • Is our industry spending enough time and attention on premium, premium light and sub premiums? • Currently All Others sell 61M bbls while ABI and MC combined sell over 148M bbls. • Are you spending twice as much time on premium, premium light and sub premium as you spend on All Others? • How many presales people did you have in 2008? How many do you have now? • Is retail taking space from ABI / MC and giving it to specialty, craft, FMB’s, etc.? • We are not saying to diminish effort on All Others, only increase effort on premium, premium light and sub premiums.
Margin • Margins will be up but will increase slower. • Return to normal at CPI– 2.5% to 3.0%.
Cost • Labor costs will increase. • Number of people. • Particularly ABI/MC sales people. • Wages per person. • Capital expenditures will increase faster than before. • Many distributors have used up excess capacity. • Size matters. • Mega distributors. • 16% cost / 26% margin / $1.75 ++ profit per c/e. • 30 distributors = 30% of volume. • Traditional distributors. • 21 % cost / 25% margin / less than $1.00 profit. • 920 = 60% of volume. • “All Other” distributors will increase but will be more expensive to operate. • 1,000 to 2,500 = 10% of volume. • Plenty of access to market.
Consolidation • Pace of consolidation will increase. • Value will depend on location, portfolio depth and diversity, strategic potential, number of people interested. • Access to market will be expanded. • Self distribution, Specialty Distributors, Wine / Spirits, Distributors, Soft Drink Bottlers. • Industry will be less stable. • Legislative changes escalating. • On-going violations of 3-tier principles. • Supplier self distribution. • Distributors with more diverse portfolios makes it harder to defend beer’s protection. • Mega distributors, supplier distribution and specialty distributors will grow while traditional distributors will get squeezed from both ends. • Value of distributorships has grown significantly. • Less desirable markets will be difficult to sell. • Growth markets with good portfolios can name their price.
WA ABI ME MT ND VT MN OR X NH MA ABI ID WI NY SD Keith & Don RI WY MI CT ABI PA Hand NJ X IA X NE X NV OH DE IN IL CO UT X ABI ABI Stokes MD WV VA KS MO CA KY Jefferies Hand ABI NC TN ABI AZ Hensley Dobbs OK AR SC NM TX Ben E. Keith GA AL MS Dormity X Nau LA FL Lamantia ABI Mega Distributors
WA CoHo ME MT Taylor ND VT MN OR NH MA ID WI NY SD ? Clay Reyes RI WY MI CT North Coast PA Ingram NJ IA X NE NV Clay OH Monarch CO DE IN IL UT MC MD WV Reyes VA KS MO CA X X KY AZ NC X Goldring / Moffat Reyes TN X Clay OK Glazer AR SC Reyes NM GA Andrews AL MS X X TX Keg 1 Goldring / Moffat Reyes LA Glazer Taylor FL Gold Coast Andrews MC Mega Distributors
Click WA ME MT Maletis ND Sheehan VT MN OR Sheehan NH MA ID WI Sheehan NY SD RI WY MI CT Sheehan PA NJ IA Saccani NE NV Rucker OH CO DE SW&S Wirtz X IN IL UT X Sheehan X MD Major Brands WV Sheehan VA KS Self MO CA KY Sheehan X AZ NC Nackard Clement TN X OK AR SC SW&S Stone X NM Ben E. Keith Lamantia GA Young AL MS TX LA Brown FL Craft Mega Distributors X – W/S with significant beer.
Positives • Craft category’s creativity, intellect and entrepreneurial spirit creates excitement in industry. • Beer distributors retail penetration is superior to wine and spirits / specialty and self-distribution (structural advantage). • Soft drink? • ABI distributors Monster performance vs. Coke Bottlers. • Marketing potential. • Import / craft marketing is fabulous. • Major brewers marketing potential. • Growing Hispanic demographic. • Potential to expand consumer base with sweeter, flavored products to women and young adults. • Increasing competition. • Gold system (Crown) is a 3rd competitor to ABI / MC.
Major Points • IBG believes volume will be negative for several years. • We get a new generation of consumers in 2020 to 2025. • Wine and spirits will try to take share of stomach and will not stop until someone stops them. • Beer distributors will become beverage distributors. • Beer distributors make less per case but sell more cases and could make more money. • Beer distributors will have less franchise protection in some states. • Beer Distributors will need to allocate more resources to mega brands. • Mega brands will not continue to pay the freight for others.
Model - 2020 • Challenge: • How to add complexity, contain costs and provide “brand building” benefits.
Model – 2020 • “Gigantic” attitude adjustment. • ABI’s Impact Selling System was fantastic push system. • Distributors need to focus on marketing to consumers at retail (pull, not push). • Do you believe beer distributors can significantly influence consumer purchase at retail? • Account managers should be responsible for creating a dynamic purchase environment that emphasizes brand development – “pull” marketing. • More time to sell at store level. • More presales people. • More E-commerce. • Transition replenishment from presales person to retailers through technology. • More inside selling in a professional manner.
Model - 2020 • Volume. • Need to be beverage / DSD distributors. • Will have a larger geographical footprint. • Will have different territorial descriptions for different categories. • Will have unique accounts. • Operating Costs. • 12% - 30% average Operating Cost as a % of sales depending on scale and performance requirements. • Mega – 12%, traditional – 18%, others – 30%. • ABI / MC and many distributors have recently cut costs and raised prices but have been ineffective at marketing. • Many brewers are slowly taking margin from distributors and we expect this to escalate.
Model - 2020 • Margin. • 18% to 35%. • Average will tend to be lower than today. • Profit. • More total profitability but less per case.
3 Things To Remember • Distribution system needs to focus more time, people and money at improving retail performance (pull, not push). • Distribution system will be more complex and less protected in the future. • Consolidation will be much more difficult and time consuming due to the number of suppliers and categories involved.