Download
1 / 11
110 likes | 489 Views
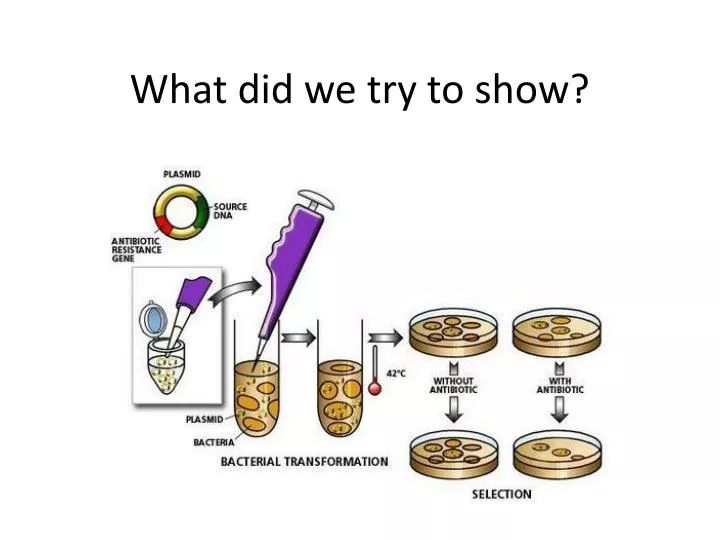
What did we try to show?. Bacterial Transformation LAB. Read the lab safety information and write the complete procedure (pp. S103-S105) in your notebook. THIS MUST BE DONE BEFORE YOU CAN PROCEED WITH THE LAB .

E N D
Bacterial Transformation LAB • Read the lab safety information and write the complete procedure (pp. S103-S105) in your notebook. THIS MUST BE DONE BEFORE YOU CAN PROCEED WITH THE LAB. 3. Write a simple hypothesis by comparing your sample with that of a partner’s, or design what to sample and test. When I come around please flip notebook to the procedure you completed before starting the lab yesterday. 20 points. Can recover lost points by writing a good practice hypothesis: Null/alternative OR If/then statement
Bacterial Transformation LAB • Make a hypothesis. Hypotheses (write all possible outcomes of experiment) • H0: the null hypothesis; the hypothesis of no difference; e.g. the test group results were not different from the control group results (A=B) • H1or HA: the alternate hypothesis; the hypothesis of difference; the test group results were significantly different than the control group (A≠B) • There can be more than one alternate hypothesis and they can be directional (<,>,≤,≥,…) •Identify the: • Independent Variable (I.V.) = the one that you can control the change, this is the x-variable on a graph • Dependent Variable (D.V.) = the one that you measure the change, this is the y-variable on a graph Form a hypothesis by following the general outline given at the beginning of the year:
Bacterial Transformation LAB Think about what was in the plate. + LB - LB What were you testing? Why the different plates? What will growth or no growth in the plates tell you? What was expected to happen? What does growth mean? What does no growth mean? + LB-amp - LB- amp
Bacterial Transformation LAB • What is the null hypothesis? • If the plasmid was not taken up, we expect to find growth… • What does the bacteria without the plasmid tell us? (i.e. Why a control group?) • What is the alternative hypothesis? • If the plasmid was taken up we expect to find growth… • What does the LB-only plate tell us? (i.e. How is this a control?) • What are your variables? So in your hypothesis include the following:
Bacterial Transformation LAB ■Analyzing Results Think about these questions before collecting data and analyzing your results. Be sure to record your answers in your laboratory notebook. 1. On which of the plates would you expect to find bacteria most like the original nontransformed E. coli colonies you initially observed? Why? 2. If there are any genetically transformed bacterial cells, on which plate(s) would they most likely be located? Again, why? 3. Which plates should be compared to determine if any genetic transformation has occurred? Why? 4. What barriers might hinder the acquisition of plasmids? 5. How can the procedures described above (addition of CI2 and “heat shocking”) help facilitate the introduction of plasmids into the E. coli cells? Answer Analyzing Results questions p. S105 But put before the Analyzing Results section.
Bacterial Transformation LAB 1. Do your results support your original predictions about the “+ plasmid” transformed E. coli cells versus “- plasmid” nontransformed cells? 2. Which of the traits that you originally observed for E. coli did not seem to become altered? Which traits seem now to be significantly different after performing the transformation procedure? 3. What evidence suggests that the changes were due to the transformation procedures you performed? 4. What advantage would there be for an organism to be able to turn on or off particular genes in response to certain conditions? 5. Was your attempt at performing a genetic transformation successful? If so, how successful? Answer the next set of questions (p.S106)in essay form in your conclusion.
Bacterial Transformation LAB Complete a data table in the results section of the write-up by looking at your plates
Bacterial Transformation LAB • Transformation efficiency = DNA in μg= (concentration of DNA of μg/μL) x (volume of DNA in μL) What was the volume of the DNA solution you put on the plate? Calculations We will use class data: 7 colonies total Multiply your group’s DNA mass (𝜇𝑔) by 5 because there were 5 groups
Bacterial Transformation LAB • Calculate the total number of transformed cells. n=7 • Calculate the amount (mass) of plasmid DNA (pAMP) in μgper 1 μL of solution. pAMP= (0.005μg/μL) x 10μL pAMP = 0.05 μgx5 = 0.25μg Remember 5 groups:
Bacterial Transformation LAB Fraction of DNA used = Volume spread on the LB/amp plate (μL) Total sample volume in test tube (μL) Fraction DNA = x = 0.2 Remember 5 groups: