Download
1 / 16
160 likes | 250 Views
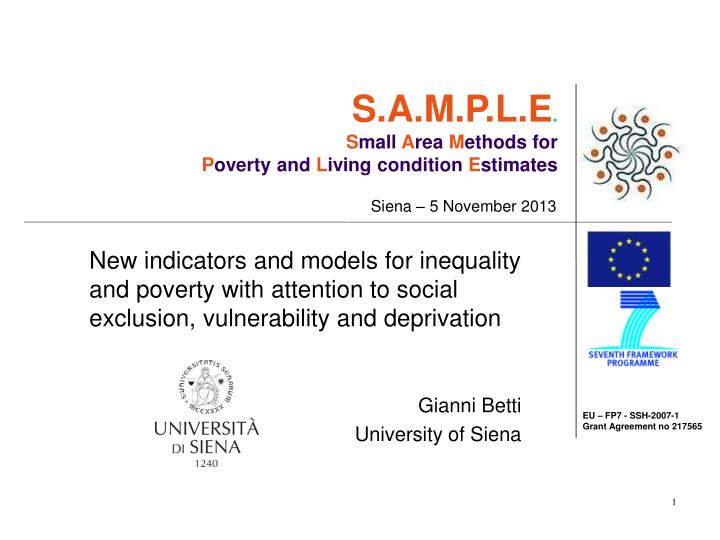
S.A.M.P.L.E . S mall A rea M ethods for P overty and L iving condition E stimates. Siena – 5 November 2013. New indicators and models for inequality and poverty with attention to social exclusion, vulnerability and deprivation. Gianni Betti University of Siena. Table of contents.

E N D
S.A.M.P.L.E.Small Area Methods forPoverty and Living condition Estimates Siena – 5 November 2013 New indicators and models for inequality and poverty with attention to social exclusion, vulnerability and deprivation Gianni Betti University of Siena
Table of contents List of Tasks of WP1: 1. Task 1.1. The indicators of poverty 2. Task 1.2. EU-SILC over sampling 3. Task 1.3. Pooled estimates of indicators 4. Task 1.4. Indicators for Local Government
Task 1.1. The indicators of poverty - 1 • Thematic literature review: • Traditional poverty measures. • Review of several Multidimensional. • Fuzzy measures. • Background of the Laeken Indicators. • Proposal for new multidimensional and fuzzy measures of poverty and inequality: • Fuzzy monetary and Fuzzy non-monetary indicators following the ntegrated Fuzzy and Relative Approach (CRIDIRE). • Fuzzy monetary Depth and Fuzzy Supplementary Depth indicators (WSE). • Development of re-sampling methods for variance estimation for multidimensional measures of poverty: • Jack Knife Repeated Replication method (CRIDIRE). • Bootstrap Method (WSE).
Poverty is a Fuzzy State It is not a discrete attribute characterised in terms of presence or absence It is rather a vague predicate that manifests itself with different shades and degrees Poor Non-poor 0 Z Y Nevertheless, traditional methods of analysis treat poverty as dichotomous variable, a simplification that wipes out all the nuances that exist between the two extremes Task 1.1. The indicators of poverty - 2 SEVERE MATERIAL HARDSHIP HIGH WELFARE
Membership functions Reconsider the definition of the membership function based on monetary variables Cheli and Lemmi (1995) Betti and Verma (1999) Task 1.1. The indicators of poverty - 3
Corresponding to the following projections: Task 1.1. The indicators of poverty - 4
Definition of the membership function Betti, Cheli Lemmi and Verma (2005, 2006) The definition of the membership function is based on the monetary variable, where the alpha parameter is chosen such that the mean is equal to the Head Count Ratio. Task 1.1. The indicators of poverty - 5
Poverty and inequality The Fuzzy Monetary (FM) measure, as defined in the previous slide, is expressible in terms of the generalised Gini measures. This family of measures (often referred to as "s-Gini") is a generalisation of the standard Gini coefficient, the latter corresponding to G with =1. In the continuous case it is defined as: Betti, Cheli Lemmi and Verma (2006) define it as: “Integrated Fuzzy and Relative” (IFR) Task 1.1. The indicators of poverty - 6
Task 1.1. The indicators of poverty - 7 • Proposal for new multidimensional and fuzzyFuzzy Supplementary Indicator • To quantify and put together diverse indicators several steps are necessary: • Identification of items; • Transformation of the items into the [0, 1] interval; • Exploratory and confirmatory factor analysis; • Calculation of weights within each dimension (each group); • Calculation of scores for each dimension; • Calculation of an overall score and the parameter; • Construction of the fuzzy deprivation measure in each dimension (and overall).
Task 1.1. The indicators of poverty - 87 dimensions are identified: • Basic life-style – these concern the lack of ability to afford most basic requirements: Keeping the home (household’s principal accommodation) adequately warm; Paying for a week’s annual holiday away from home; Eating meat chicken or fish every second day, if the household wanted to; Ability to make ends meet. • Financial situation – these concern the lack of ability to pay in time due to financial difficulties: Inability to cope with unexpected expenses; Arrears on mortgage or rent payments; Arrears on utility bills; Arrears on hire purchase instalments. • Housing amenities – these concern the absence of basic housing facilities (so basic that one can presume all households would wish to have them): A bath or shower; An indoor flushing toilet; Leaking roof and lamp; Rooms to dark. • Environmental problems – these concern problems with the neighbourhood and the environment: Pollution; Crime, violence, vandalism; Noise. • Consumer durables - these concern enforced lack of widely desired possessions ("enforced" means that the lack of possession is because of lack of resources): A car or van; A colour TV; A pc; A washing machine; A telephone. • Health related – these concern problems with personal health: General health; Chronic illness; Mobility restriction.
Development of SAS programs for poverty measures and variance estimation Task 1.1. The indicators of poverty - 9 Methods proposed in theory: Jack-knife repeated replications (JRR - CRIDIRE) Taylor linearisation (CRIDIRE) Bootstrap (WSE) Implementation with SAS and R routines for JRR and Bootstrap
Task 1.1. Some empirical results - 1 Figure 1. EU: Net equivalent income – NUTS1 regions
Task 1.1. Some empirical results - 2 Figure 2. Head Count Ratio NUTS2 regions (country poverty lines)
Task 1.1. Some empirical results - 3 Figure 3. Overall Non-monetary deprivation rates, NUTS1 regions
Task 1.1. Some empirical results - 4 Figure 4. Environmental Problems, NUTS1 regions
Task 1.1. Some empirical results - 5 Figure 5. Environmental Problems, NUTS2 regions