Download
1 / 63
630 likes | 700 Views
Chapter Five. Cost Behaviour: Analysis and Use. Learning Objectives. After studying this chapter, you should be able to:. 1. Describe how fixed and variable costs behave and how to use then to predict costs. 2. Use a scattergram plot to diagnose cost behaviour.

E N D
Chapter Five Cost Behaviour:Analysis and Use
Learning Objectives After studying this chapter, you should be able to: 1. Describe how fixed and variable costs behave and how to use then to predict costs. 2. Use a scattergram plot to diagnose cost behaviour. 3. Analyze a mixed cost using the high-low method. • Analyze a mixed cost using least-squares regression.
Learning Objectives After studying this chapter, you should be able to: • Prepare an income statement using the contribution format. 6. (Appendix 5A) Least-squares regression method elaborated.
Types of Cost Behaviour Patterns Recall the summary of our cost behavior discussion from an earlier chapter.
Unitsproduced Machine hours Miles driven labour hours The Activity Base A measure of what causes the incurrence of a variable cost
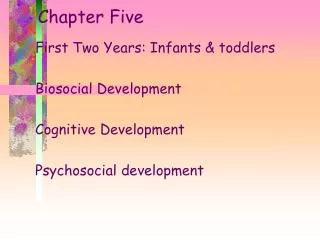
True Variable Cost Example A variable cost is a cost whose total dollar amount varies in direct proportion to changes in the activity level. Your total long distance telephone bill is based on how many minutes you talk. Total Long DistanceTelephone Bill Minutes Talked
Types of Cost Behaviour Patterns Recall the summary of our cost behavior discussion from an earlier chapter.
Variable Cost Per Unit Example A variable cost remains constant if expressed on a per unit basis. The cost per minute talked is constant. For example, 10 cents per minute. Per MinuteTelephone Charge Minutes Talked
Extent of Variable Costs The proportion of variable costs differs across organizations. For example . . . A public utility withlarge investments inequipment will tendto have fewervariable costs. A manufacturing companywill often have manyvariable costs. A merchandising companyusually will have a high proportion of variable costs like cost of sales. A service companywill normally have a high proportion of variable costs.
Examples of Variable Costs • Merchandising companies – cost of goods sold. • Manufacturing companies – direct materials, direct labour, and variable overhead. • Merchandising and manufacturing companies – commissions, shipping costs, and clerical costs such as invoicing. • Service companies – supplies, travel, and clerical.
True Variable Cost Direct materials is a true or proportionately variable cost because the amount used during a period will vary in direct proportion to the level of production activity. Cost Volume
Cost Volume Step-Variable Costs A resource that is obtainable only in large chunks (such as maintenance workers) and whose costs increase or decrease only in response to fairly wide changes in activity is known as a step-variable cost.
Cost Volume Step-Variable Costs Small changes in the level of production are not likely to have any effect on the number of maintenance workers employed.
Cost Volume Step-Variable Costs Only fairly wide changes in the activity level will cause a change in the number of maintenance workers employed
A straight line closely approximates a curvilinear variable cost line within the relevant range. RelevantRange Accountant’s Straight-Line Approximation (constant unit variable cost) The Linearity Assumption and the Relevant Range Economist’sCurvilinear Cost Function Total Cost Activity
Types of Cost Behaviour Patterns Let’s look at fixed cost behavior on the next screens.
Total Fixed Cost Example A fixed cost is a cost whose total dollar amount remains constant as the activity level changes. Your monthly basic telephone bill is probably fixed and does not change when you make more local calls. Monthly Basic Telephone Bill Number of Local Calls
Types of Cost Behaviour Patterns Recall the summary of our cost behaviour discussion from an earlier chapter.
Fixed Cost Per Unit Example Average fixed costs per unit decrease as the activity level increases. The fixed cost per local call decreases as more local calls are made. Monthly Basic Telephone Bill per Local Call Number of Local Calls
Types of Fixed Costs Committed Long-term, cannot be significantly reduced in the short term. Discretionary May be altered in the short-term by current managerial decisions Examples Depreciation on Equipment and Real Estate Taxes Examples Advertising and Research and Development
The Trend Toward Fixed Costs The trend in many industries is toward greater fixed costs relative to variable costs. As machines take overmany mundane taskspreviously performedby humans, “knowledge workers”are demanded fortheir minds ratherthan their muscles Knowledge workerstend to be salaried,highly-trained anddifficult to replace. Thecost to compensatethese valued employeesis relatively fixedrather than variable.
Is Labour a Variable or a Fixed Cost? The behaviour of wage and salary costs can differ across countries, depending on labour regulations, labour contracts, and custom. In France, Germany, China, and Japan management has little flexibility in adjusting the size of the labour force.Labour costs are more fixed in nature. In the United States and the United Kingdom management has greater latitude. Labour costs are more variable in nature.
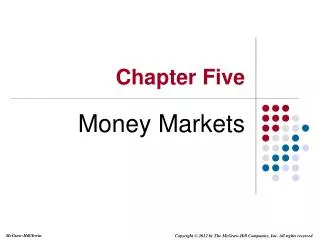
Fixed Costs and Relevant Range 90 Total cost doesn’t change for a wide range of activity, and then jumps to a new higher cost for the next higher range of activity. Relevant Range 60 Rent Cost in Thousands of Dollars 30 0 0 1,000 2,000 3,000 Rented Area (Square Feet)
Example: Office space is available at a rental rate of $30,000 per year in increments of 1,000 square feet. As the business grows more space is rented, increasing the total cost. Fixed Costs and Relevant Range The relevant range of activity for a fixed cost is the range of activity over which the graph of the cost is flat.
Fixed Costs and Relevant Range • Step-variable costs can be adjusted more quickly and . . . • The width of the activity steps is much wider for the fixed cost. How does this type of fixed cost differ from a step-variable cost?
Which of the following statements about cost behaviour are true? Fixed costs per unit vary with the level of activity. Variable costs per unit are constant within the relevant range. Total fixed costs are constant within the relevant range. Total variable costs are constant within the relevant range. Quick Check
Which of the following statements about cost behaviour are true? Fixed costs per unit vary with the level of activity. Variable costs per unit are constant within the relevant range. Total fixed costs are constant within the relevant range. Total variable costs are constant within the relevant range. Quick Check
Y X Mixed Costs A mixed cost has both fixed and variablecomponents. Consider the example of utility cost. Total mixed cost Total Utility Cost Variable Cost per KW Fixed MonthlyUtility Charge Activity (Kilowatt Hours)
Y X Mixed Costs Total mixed cost Total Utility Cost Variable Cost per KW Fixed MonthlyUtility Charge Activity (Kilowatt Hours)
Y = a + bX Y = $40 + ($0.03 × 2,000) Y = $100 Mixed Costs Example If your fixed monthly utility charge is $40, your variable cost is $0.03 per kilowatt hour, and your monthly activity level is 2,000 kilowatt hours, what is the amount of your utility bill?
Analysis of Mixed Costs Account Analysis and the Engineering Approach Each account is classified as eithervariable or fixed based on the analyst’s knowledge of how the account behaves. Cost estimates are based on an evaluation of production methods, and material, labour and overhead requirements.
Y 20 * * * * * * * * Maintenance Cost1,000’s of Dollars * * 10 0 X 0 1 2 3 4 Patient-days in 1,000’s The Scattergraph Method Plot the data points on a graph (total cost vs. activity).
Y 20 * * * * * * * * Maintenance Cost1,000’s of Dollars * * 10 0 X 0 1 2 3 4 Patient-days in 1,000’s The Scattergraph Method Draw a line through the data points with about anequal numbers of points above and below the line.
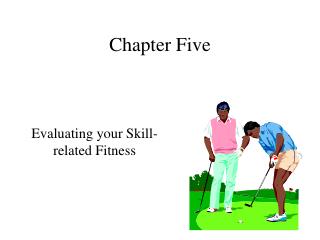
Y Total maintenance cost = $11,000 20 * * * * * * * * Maintenance Cost1,000’s of Dollars * * 10 Intercept = Fixed cost: $10,000 0 X 0 1 2 3 4 Patient-days in 1,000’s Patient days = 800 The Scattergraph Method Use one data point to estimate the total level of activity and the total cost.
$1,000 800 Variable cost per unit = = $1.25/patient-day Total maintenance cost Number of patient days The Scattergraph Method Make a quick estimate of variable cost per unit and determine the cost equation. Y = $10,000 + $1.25X
Assume the following hours of maintenance work and the total maintenance costs for six months. The High-Low Method
$2,400300 =$8.00/hour The High-Low Method The variable cost per hour of maintenance is equal to the change in cost divided by the change in hours.
Total Fixed Cost = $9,800 – $6,400 Total Fixed Cost = $3,400 The High-Low Method Total Fixed Cost = Total Cost – Total Variable Cost Total Fixed Cost = $9,800 – ($8/hour × 800 hours)
The Cost Equation for Maintenance Y = $3,400 + $8.00X The High-Low Method
Sales salaries and commissions are $10,000 when 80,000 units are sold, and $14,000 when 120,000 units are sold. Using the high-low method, what is the variable portion of sales salaries and commission? a. $0.08 per unit b. $0.10 per unit c. $0.12 per unit d. $0.125 per unit Quick Check
Sales salaries and commissions are $10,000 when 80,000 units are sold, and $14,000 when 120,000 units are sold. Using the high-low method, what is the variable portion of sales salaries and commission? a. $0.08 per unit b. $0.10 per unit c. $0.12 per unit d. $0.125 per unit $4,000 ÷ 40,000 units = $0.10 per unit Quick Check
Sales salaries and commissions are $10,000 when 80,000 units are sold, and $14,000 when 120,000 units are sold. Using the high-low method, what is the fixed portion of sales salaries and commissions? a. $ 2,000 b. $ 4,000 c. $10,000 d. $12,000 Quick Check
Sales salaries and commissions are $10,000 when 80,000 units are sold, and $14,000 when 120,000 units are sold. Using the high-low method, what is the fixed portion of sales salaries and commissions? a. $ 2,000 b. $ 4,000 c. $10,000 d. $12,000 Quick Check
Least-Squares Regression Method A method used to analyze mixed costs if a scattergraph plot reveals an approximately linear relationship between the X and Y variables. This method uses all of thedata points to estimatethe fixed and variablecost components of amixed cost. The goal of this method isto fit a straight line to thedata that minimizes thesum of the squared errors.
Software can be used to fit a regression line through the data points. The cost analysis objective is the same: Y = a + bX Least-Squares Regression Method Least-squares regression also provides a statistic, called the R2, that is a measure of the goodnessof fit of the regression line to the data points.
Least-Squares Regression Method R2 is the percentage of the variation in total cost explained by the activity. Y 20 * * * * * * * * * * Total Cost 10 R2 varies from 0% to 100%, andthe higher the percentage the better. 0 X 0 1 2 3 4 Activity
The three methods just discussed provide slightly different estimates of the fixed and variable cost components of the mixed cost. This is to be expected because each method uses differing amounts of the data points to provide estimates. Least-squares regression provides the most accurate estimate because it uses all the data points. Comparing Results From the Three Methods
Let’s put our knowledge of cost behaviour to work by preparing a contribution format income statement.
The contribution margin format emphasizes cost behaviour. Contribution margin covers fixed costs and provides for income. The Contribution Format
Uses of the Contribution Format • The contribution income statement format is used as an internal planning and decision making tool. We will use this approach for: • Cost-volume-profit analysis (Chapter 6). • Budgeting (Chapter 9). • Segmented reporting of profit data (Chapter 12). • Special decisions such as pricing and make-or-buy analysis (Chapter 13).