Download
1 / 25
270 likes | 368 Views
XBT in Mediterranean Sea. F.Reseghetti (ENEA-ACS-Clim-Med), Lerici (Sp) - Italy M.Borghini (CNR-ISMAR), Lerici (Sp) - Italy G.M.R.Manzella (ENEA-ACS-Clim), Lerici (Sp) - Italy. Reference paper: Reseghetti, Borghini, Manzella (Ocean Science 3, 59-75, 2007). Issues.

E N D
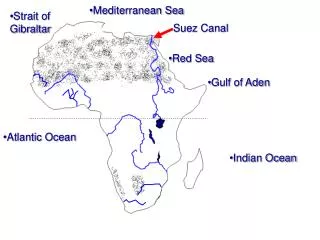
XBT in Mediterranean Sea F.Reseghetti (ENEA-ACS-Clim-Med), Lerici (Sp) - Italy M.Borghini (CNR-ISMAR), Lerici (Sp) - Italy G.M.R.Manzella (ENEA-ACS-Clim), Lerici (Sp) - Italy Reference paper: Reseghetti, Borghini, Manzella (Ocean Science 3, 59-75, 2007)
Issues • Extended acquisition + Time as free parameter • Time response of data acquisition system • Initial launching conditions • Weight of the probe • Calibration • Data processing • Fall rate coefficients (FRCs) • Temperature Correction • Depth error • T accuracy
Preliminary • No comparison between XBT profiles (after the processing with the software) and co-located and contemporaneous CTD measurements in Mediterranean Sea • No check on XBT output in Mediterranean seawaters assuming the validity of error interval as Sippican did. • Comparison between CTD casts (42) and contemporaneous and co-located XBTs dropped from a steady ship (URANIA) (55) in Western Mediterranean • CTD casts were done by SEABIRD 911 Plus instruments, calibrated (before and after) each cruise: May 2003 (1); September 2003 (10); January 2004(12); May 2004(10); September 2004(10); October 2004(12). • All CTD profiles were processed with standard SEABIRD software. • Only Sippican XBTs dropped and recorded by the same Sippican MK-12 read-out card and software + the same PC. • The time delay (XBT-CTD) is ranging from 1 to 8 minutes. • ALL T values are “in-situ” Temperatures.
Issue 2: Response time The XBT probe thermistor has a finite response time to temperature changes. The time constant is 0.16 s. LM Sippican states, that the thermistor used will respond to a step change of temperature in a time period of 0.63 s. Assuming a fall speed of 6.472 ms-1this corresponds to a depth of 4 m. Because of the finite response time the true sea temperature is not sensed until the probe reaches 4 m depth. If there is a significant temperature difference between the probe storage temperature and the sea surface temperature a strong temperature gradient will be recorded in the first 4 m.(AODC MK12 Cookbook, 1999) • Possible solution is to experimentally compute the time each probe needs before it measures “stable” T values (within 0.1°C), the Empirical Time Constant • The averaged experimental value is ETC = 0.3 ± 0.1 s • Each T profile is cut and rescaled by ETC: • T(t0) = T(t0 + 0.3 s)= T(t0+3) from the beginning • Then, identification of the time t0 at which strong dT/dz starts (seasonal thermocline) (rule = four consecutive t intervals where dT/dz < - 0.1 ºC). • Practically, each profile is shifted up by about 2m.
Depth (m) - Temperature (°C) 0.017.54 1516.69 0.716.38 1513.25 1.315.98 1512.06 2.015.84 1511.64 2.7 15.82 1511.58 3.3 15.81 1511.58 4.0 15.82 1511.60 Depth (m) - Temperature (°C) 0.017.64 1517.00 0.716.48 1513.56 1.316.14 1512.54 2.016.04 1512.25 2.7 16.01 1512.16 3.3 15.99 1512.13 4.0 15.99 1512.14 Depth (m) - Temperature (°C) 0.018.24 1518.73 0.716.74 1514.34 1.316.25 1512.89 2.016.10 1512.44 2.7 16.06 1512.32 3.3 16.05 1512.29 4.0 16.03 1512.27 Depth (m) - Temperature (°C) 0.0 22.72 1523.25 0.7 22.72 1523.27 1.3 22.83 1523.56 2.0 22.86 1523.66 2.7 22.88 1523.72 3.3 22.87 1523.69 4.0 22.84 1523.63 Depth (m) - Temperature (°C) 0.0 23.10 1524.23 0.7 22.89 1523.70 1.3 22.68 1523.18 2.0 22.58 1522.92 2.7 22.23 1522.01 3.3 21.61 1520.38 4.0 21.13 1519.08 Depth (m) - Temperature (°C) 0.0 20.54 1525.17 0.7 19.87 1523.34 1.3 19.57 1522.53 2.0 19.46 1522.24 2.7 19.43 1522.16 3.3 19.41 1522.12 4.0 19.41 1522.12
Issue 3: Initial conditions • The height of launching positions seems do not influence in a predictable way the initial motion of the probe. Suggested height 2.5 m: in MFSTEP the height varies from 4 to 14 m. In literature, steady regime after ~ 1.5 s (~ 10 m). • Ambiguous results for the depth discrepancy at the thermocline depth from URANIA tests (2.5 m and 8 m). • In green the former launched, in blue the latter
Issue 4: Weight Seaver & Kuleshov
Issue 5: Calibrations • Six T4 and six DB probes were calibrated at NURC-La Spezia • 10 minutes in the bath to thermalize the probe • 30 s of data acquisition • 4 different reference temperatures • All the probes measure always T values warmer than the bath T4 : T (T )= (0.01845±0.00852)°C+ (0.00212±0.00046)∙T DB: T (T )= (0.03222±0.00970)°C+ (0.00162±0.00052)∙T
Issue 6: Data processing • Improvement with respect to Manzella et al.(2003) • Gross range check (e.g. bottom, ground..) • General check on spatial and temporal values • Gaussian smoothing The Manzella et al. (2003) software smoothes too much the XBT raw profiles, mainly where dT/dz is significant.THEREFOREeach profile is divided in 3 regions (from the surface down to the thermocline, thermocline region, bottom), with 3 different Gaussian filter values (3-3-7 points) • Interpolation at 1-m interval(1-m = variation of 0.005 ms-1 on A, and of 0.00005 ms-2 on B; = the depth the probe moves in 0.16 s = thermistor time response detection of 63% of a step T variation) • Comparison with climatology • (Final) Visual check and consistency
Issue 7- (FRCs) • FRCs have been searched for within intervals: T4: 6.400 A 6.750 ms-1, and 0.00180 B 0.00240 ms-2; DB: 6.600 A 6.850 ms-1, and 0.00200 B 0.00260 ms-2. • Used steps: 0.005 ms-1 for A, and 0.00005 ms-2 for the B (1-m accuracy). For each T4/T6 probe, (71 x 13) profiles were computed, and (51 x 13) profiles for each DB probe. • For each CTD profile, 6 reference points below 100 m depth where thermal structures occur (by visual inspection). • The difference between the depth measured by the CTD and the one on the computed XBT profile is calculated in correspondence of such points, and summed up. • The minimum value of the sum of the depth differences indicates the best pair of FRCs for the specific profile. • Final FRCs for each XBT type are obtained by calculating the average, weighting on the length of each profile. • Obtained FRC represent a compromise between faster and slower probes; therefore, some spikes remain in temperature difference profiles. • When the best pair of FRCs is used for each probe, the difference in depth is not not larger than 3-4 m with respect to the CTD along the profile.
New Fall Rate Coefficients The coefficients are rounded to 0.005 ms-1 and 0.00005 ms-2: smaller values produce a depth variation smaller than 1m, which is the intrinsic depth accuracy due to the time constant (0.16 s 1 m).
Upper region IGOSS + M03 R07 - TC R07 + TC
Issue 8: Temperature Correction • To reduce the shift in T profile at deeper depth, a correction [linear function of the depth Y(D)=A+B*D as deduced from ΔT averaged profile (from 100 m 550 m for T4, from 100 to 900 m depth for DB)] is added to the temperature value at each depth. T4 DB A(ºC)= - 0.0285 ± 0.0010 - 0.0389 ± 0.0010 B(ºC/m)= - 0.0000135 ± 0.0000011 - 0.0000164 ± 0.0000012 A is similar to the calibration value at T~12.5°C B is similar to the pressure term cited in literature (Roemmich&Cornuelle, 1987).
Maximum observed depth difference within the sample Issue 9: Depth error
Issue 10: Global T accuracy • It is necessary to identify the thermal structures along the profile: • |T| 0.10C from the surface down to thermocline, when existing; • |T| 0.50C where the thermocline starts (if any), and proportional to its strength (with some spikes up to about 3.0C, but over a layer of a few metres); • |T| 0.07C below the base of the thermocline (|T| 0.14C in regions where identified thermal structures occur).
To do (money dependent) • Calibrate and weight the probes before a comparison • Measure the diameter of the central hole (a difference enhanced by Kizu et al. 2005) • Compare static calibrations by using MK12-MK21-MK21 USB (and Devil), and different LM3A launchers, and wires and connection boxes. • Tests on T5 probes in Mediterranean Sea • Dynamical comparison with SHUTTLE CTD, which can measure when the ship is moving (it goes up-down, at about 250 m depth, in some minutes) • Analysis in Eastern Mediterranean Sea • But I NEED XBTs Calculations of heat budget are critical when only XBT data are available, due to the influence of bias and other unknown errors in archived data.See f.i. Gouretsky&Koltermann (2007)