Download
1 / 9
100 likes | 215 Views
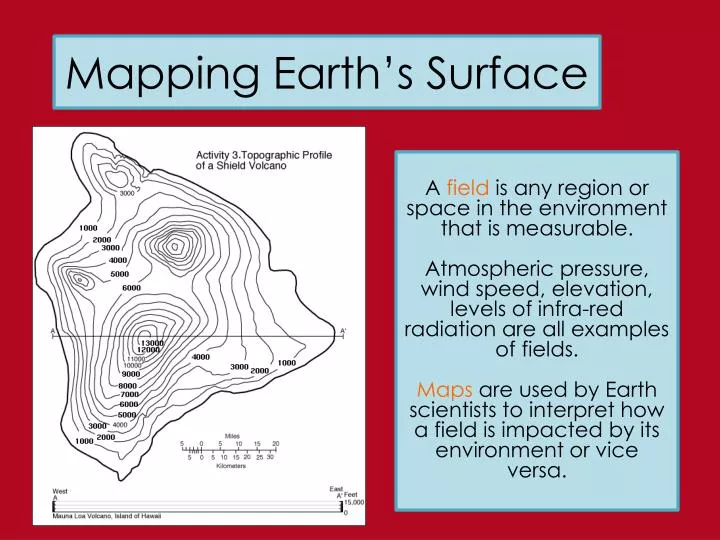
A field is any region or space in the environment that is measurable. Atmospheric pressure, wind speed, elevation, levels of infra-red radiation are all examples of fields. Maps are used by Earth scientists to interpret how a field is impacted by its environment or vice versa.

E N D
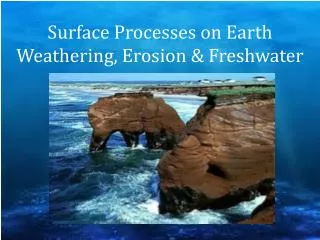
A fieldis any region or space in the environment that is measurable. Atmospheric pressure, wind speed, elevation, levels of infra-red radiation are all examples of fields. Maps are used by Earth scientists to interpret how a field is impacted by its environment or vice versa. Mapping Earth’s Surface
This isoline indicates an elevation of 3000 feet. Isolines Isolines are used on a map to connect points of equal value. Common examples of isolines include: ISOTHERMS = lines of equal temperature ISOBARS = lines of equal air pressure CONTOUR LINES = lines of equal elevation Contour lines
Gradient: Changes in Fields An environment is continually changing and therefore fields will also change. Gradient represents the rate of change from “place to place” within the field. gradient = change in (amount of) field value change in distance (horizontal distance) RT = Pg. 1 What is the temperature gradient between two cities in North Carolina on the date shown? Gradient = change in (amount of) field value change in distance (horizontal distance) City B = 30°F Gradient = 42°F – 30°F 100 miles City A = 42°F Gradient = 12°F = 0.12 °F/mi 100 miles
Contour Maps A contour map (topographic map) is a model used to show the elevation field of the Earth’s surface at a particular location. Contour maps are used as hiking aids, planning for areas of construction and resource development. Brown = landforms/elevation Blue = Water features Green = woodlands Red/Black = Human constructs (boundaries, roads, etc..)
Reading a Contour Map When contour lines cross a stream they bend towards the direction of higher elevation. Contour lines that are spaced wide apart indicate a gentle slope (gradient). An index contour appears thicker/bolder than the other contour lines. Closely spaced contour lines indicate a steep slope (gradient). A series of consecutively smaller and smaller contour lines indicates a peak in elevation.
The contour interval represents the change in elevation between two consecutive contour lines on a map. Reading a Contour Map A depression represents a decrease in elevation. Sink holes and craters represent landscape features that are depressions. A depression is represented by “hachures” on the contour lines. The first “depression contour line” will have the same contour interval as the last contour line. Each succeeding “depression contour line” will be drawn at the same contour interval as the rest of the map. The contour interval for this map is 10 ft. This first “depression contour line” would have an elevation of 140 ft; the same as the previous contour line. The second “depression contour line” would have an elevation of 130 ft.
Determining Horizontal Distance on a Contour Map The horizontal distance on a contour map is usually represented as a map scale in the legend of the contour map. To determine the horizontal distance between two locations on a contour map: Place a piece of paper with a straight edge on the map and mark the two locations Match up the marks on the map scale to estimate the horizontal distance between the two points. What is the distance between the school and post office? 2.3 km
Topographic Profile A topographic profile is a cross section of a landscape constructed from data collected from a contour map. To make a topographic profile, complete the following steps: Place the edge of a strip of paper along the line to be profiled. Make a mark on the paper at each point where a contour line crosses it. Record the elevation at each point. Align the paper along the x-axis of a graph and plot the points of elevation onto the graph. Connect the points with a smooth, curved line.
Map Direction Maps are usually constructed so that geographic North is at the top of the map. An arrow or a “compass rose” is most usually placed on the map to show the direction of geographic North. Knowing where North is on a map, allows the observer to determine the other 7 cardinal directions Compass Rose Where can Bluewater Lake be found with relation to Kennedy Lake? Southeast