Download
1 / 23
230 likes | 358 Views
Summary of 2014 ESEA Grades. Required USED Components of the ESEA Waiver for the State-based System of Accountability. The State’s Accountability System must: A pply to all districts and all schools, I nclude ELA, math and graduation rate for all students and all subgroups,

E N D
Required USED Components of the ESEA Waiverfor the State-based System of Accountability The State’s Accountability System must: • Apply to all districts and all schools, • Include ELA, math and graduation rate for all students and all subgroups, • Include school performance and progress over time for all students and all subgroups, • Include student growth no later than Spring 2015, and • Include ambitious but achievable AMOs.
South Carolina’s Goals in Submitting the ESEA Flexibility Waiver Request and the Renewal The new Accountability system must be: • Easy to understand. • Transparent. • Not an “all or nothing” system. • Ambitious, but achievable. • A means to identify Title 1 schools most in need of assistance. • A modernized state-based accountability system that unifies state and federal accountability elements to provide accurate and meaningful data to students, parents, educators, and the public.
District and School Grading Scale inSouth Carolina’s ESEA Flexibility Waiver Grades of A, B, and C meet or exceed the State’s Expectation.
2014 ESEA Grades Point System for Schools and Districts • For any subject or student group: • If the mean meets or exceeds the target (AMO), the matrix reflects a 1.0 in that cell • If the mean is below the AMO, but at or above Proficient, a .6 through .9 would reflect which quartile between proficient and the AMO the mean falls. • If the mean is below Proficient: • .1 through .5 reflects an increase in the mean from the previous year for that student group/subject. • .1 reflects one scale score point increase in the mean from the previous year up to .5.
Awarding Points in ESEA Grades 1.0 = the average of student scores is above the Target .9 .8 .7 .6 .5 = The average improved 5 points over the previous year’s average. .4 = The average improved 4 points over the previous year’s average. .3 = The average improved 3 points over the previous year’s average. .2 = The average improved 2 points over the previous year’s average. .1 = The average improved 1 point over the previous year’s average. 0 = The average is below Proficient and showed no improvement over previous year’s mean. Target Average is between the Target and Proficient. Proficient
Annual Measureable Objectives (AMOs) / Targetsfor Districts’ and Schools’ Mean PerformanceNo changes to AMOs were proposed in the Principle Two Amendment
Recent ESEA Grades Updates to the Technical Manual • An ESEA Grade will not be calculated for new schools until the new school has been in operation for two years. • The calculation of an ESEA Grade for reconstituted schools will be considered on a case-by-case basis. • The All Students group will have no minimum “N” size to be included in the calculation of an ESEA Grade. • End of Course test results used in the ESEA Grade calculation will be from the current school year (September through August), rather than using lagged test results from the previous school year. • The graduation rate used in the ESEA High School Grade calculation is from the current school year, rather than using a lagged graduation rate from the previous school year. • Standard Errors of Measurement (SEMs) will not be used in the ESEA Grade calculation. • SC-Alt scores will be merged with other state assessment scores rather than posted in a separate matrix.
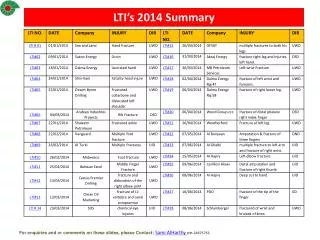
Summary Chartsfor 2014 ESEA GradesNote: Data as of October 22, 2014
Comparison of 2014, 2013 and 2012 ESEA/Federal Accountability to 2011 NCLB/AYP Results Percent of Schools That Meet or Exceed State’s Expectations by Type of School ESEA Grades = A, B, C and AYP = MET Legend 2011 NCLB/AYP 2012 ESEA Federal Accountability 2013 ESEA Federal Accountability2014 ESEA Federal Accountability Percentages may not equal 100% due to rounding 2012 ESEA results above reflect those schools that also received AYP in 2011.
Elementary Schools Grade Distribution Comparison of 2012, 2013 and 2014 ESEA/Federal Accountability ESEA Grades = A, B or C = MET / ESEA Grades = D or F = NOT MET Legend 2012 ESEA Federal Accountability 2013 ESEA Federal Accountability 2014 ESEA Federal Accountability Percentages may not equal 100% due to rounding 2014 ESEA results as of October 22, 2014.
Middle Schools Grade Distribution Comparison of 2012, 2013 and 2014 ESEA/Federal Accountability ESEA Grades = A, B or C = MET / ESEA Grades = D or F = NOT MET Legend 2012 ESEA Federal Accountability 2013 ESEA Federal Accountability 2014 ESEA Federal Accountability Percentages may not equal 100% due to rounding 2014 ESEA results as of October 22, 2014.
High Schools Grade Distribution Comparison of 2012, 2013 and 2014 ESEA/Federal Accountability ESEA Grades = A, B or C = MET / ESEA Grades = D or F = NOT MET Legend 2012 ESEA Federal Accountability 2013 ESEA Federal Accountability 2014 ESEA Federal Accountability Percentages may not equal 100% due to rounding 2014 ESEA results as of October 22, 2014.
Comparison of 2012, 2013 and 2014 ESEA/Federal Accountability District Grade Distribution ESEA Grades = A, B or C = MET / ESEA Grades = D or F = NOT MET Legend 2012 ESEA Federal Accountability 2013 ESEA Federal Accountability 2014 ESEA Federal Accountability
2014 ESEA/Federal Accountability District Frequency by Score and Grade Meets Expectations
The 2014 ESEA Flexibility Waiver Grade Release includes the following lists of Title I schools: • Reward for Performance Schools • Reward for Progress Schools • Priority Schools • Focus Schools The USED required the identification and the reporting of these schools. Additional USED Reporting Requirements
Title I schools that are the highest performing. In 2012 – 162 schools were recognized In 2013 – 143 schools were recognized In 2014 – 159 schools were recognized A Title I Reward School for Performance must: • have an “A” or “B” in the two most recent school years, • have a free/reduced lunch count that is > 50%, • not have significant achievement gaps, and • have at least one tested grade. Title I funds are used to provide a monetary award to the top schools in this category. Reward Schools for Performance
Reward Schools for Progress Title I schools that demonstrate the most substantial progress in student achievement from the previous school year. In 2012 – 14 schools were recognized In 2013 – 8 schools were recognized In 2014 – 26 schools were recognized A Title I Reward School for Progress must: • attain an “A”, “B”, or “C” in the two most recent school years, • have a free/reduced lunch count that is > 50%, • be in the top 10% of qualifying Title I schools that demonstrate the most significant progress in the weighted score from the previous year, and • not have a significant achievement gap. • have at least one tested grade. • Title I funds are used to provide a monetary award to the top schools in this category.
Priority Schoolsis an annual determination of the lowest performing Title I schoolsin the state. • Priority schools are determined by ranking each Title I school’s total weighted score (which determines the school’s letter grade) from lowest to highest. • In 2014, 25 schools are designated as Priority Schools, which is equal to at least 5% of the total number of Title I schools served by the State. • Only schools with at least one tested grade are included in the ranking for Priority Schools. Priority Schools • Title I funds are used to provide a supplemental allocation to schools • in this category to support interventions.
Focus Schoolsis an annual determination of the Title I schools with the highest average performance gap between subgroups not meeting the AMO/target. • ELA and math subgroup achievement gap differences will be calculated, averaged, and ranked to determine the Title I schools with the highest average achievement gap. • In 2014, 50 schools are designated as Focus Schools, which is equal to at least 10% of the total number of Title I schools served by the State. • Schools with at least one tested grade are included in the calculations. Focus Schools • Title I funds are used to provide a supplemental allocation to schools • in this category to support interventions.
For additional information or clarification: Nancy W. Busbee, PhD Accountability Division SC Department of Education nbusbee@ed.sc.gov 803-734-8105