Download
1 / 49
490 likes | 642 Views
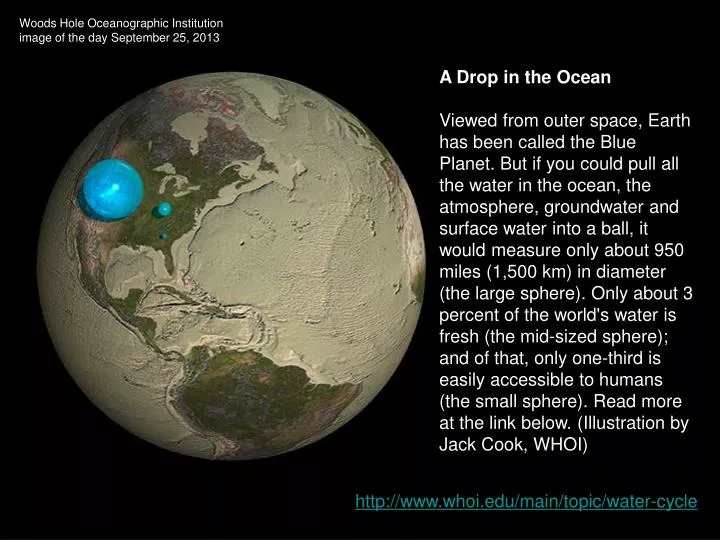
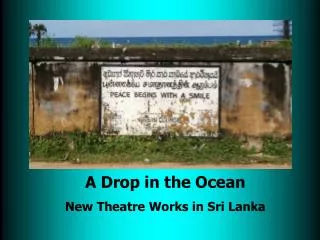
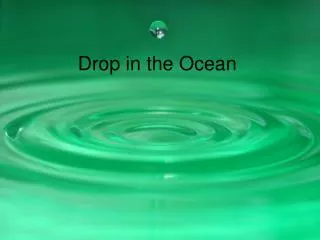
Woods Hole Oceanographic Institution image of the day September 25, 2013. A Drop in the Ocean

E N D
Woods Hole Oceanographic Institution image of the day September 25, 2013 A Drop in the Ocean Viewed from outer space, Earth has been called the Blue Planet. But if you could pull all the water in the ocean, the atmosphere, groundwater and surface water into a ball, it would measure only about 950 miles (1,500 km) in diameter (the large sphere). Only about 3 percent of the world's water is fresh (the mid-sized sphere); and of that, only one-third is easily accessible to humans (the small sphere). Read more at the link below. (Illustration by Jack Cook, WHOI) http://www.whoi.edu/main/topic/water-cycle
Marine Science 320 El Niño Southern Oscillation 2
El Niño-Southern Oscillation (ENSO) • NOAA PMEL El Niño Theme Pagehttp://www.pmel.noaa.gov/tao/elnino/nino-home.html • Southern Oscillation (atmosphere) andEl Niño (ocean) processes were identified separately, and subsequentlylinked • Walker: noted ‘see-saw’ connection in barometer data from Tahiti and Darwinand coined the term Southern Oscillation • Jacob Bjerknes connected SST, winds and SLP with atmosphere/ocean dynamics Sir Gilbert Walker • failure of monsoon rains (and famine) in 1899 • claimed Asian monsoon linked to drought in Africa and Australia, and mild winter in Canada • Widely criticized, theory dismissed (no dynamical explanation) • Never succeeded in predicting monsoon failures http://library.thinkquest.org/20901/overview_2.htm
When SOI is negative: p.g. is weaker than usual corresponds to El Nino (or ENSO warm event) Definition of the Southern Oscillation Index [ Pdiff - Pdiffav ] SOI = ----------------- SD(Pdiff) Oct2013 Pdiff = (Tahiti MSLP) - (Darwin MSLP) monthly averagedPdiffav = long term (years) average of Pdifffor the particular monthSD(Pdiff) = long term standard deviation of Pdiff Sometimes SOI is given multiplied by 10 in which case it ranges from about –35 to about +35 (i.e. +/- 3.5 std. dev.) http://iridl.ldeo.columbia.edu/maproom/.ENSO/.Time_Series/SOI.html
http://www.pmel.noaa.gov/tao/elnino/nino-home.html http://www.pmel.noaa.gov/tao/jsdisplay/
Trades weaken in Feb/Mar Upwelling slows and water warms easterlies westerlies
December 1997 Positive anomaly means winds are more westerly (toward the east) than average
El Nino - warming first occurs subsurface in the central Pacific because the thermocline is being displaced downward. http://meteora.ucsd.edu/~pierce/elnino/en97/en97.html
Warming due to thermocline displacement occurs all across. It is shallower in the east because the thermocline itself is shallower
SST now increases, apparently starting from the east, but largely due to what is happening subsurface
Loss of heat from the west has cooled the WPWP at depth Warming travels up the N.Amer west coast and spreads out into the Pacific – very slowly
El Nino contracts but waters are still cool to the west. The WPWP must reset itself slowly …
Negative means much less rain in 1999 than 1998 Positive is more rain in 1999 than 1998 ENSO conditions Top right: Two-month mean rainfall rate (mm/mon) for Jan/Feb 1998. Heavy rainfall appears over the South Pacific Convergence Zone (SPCZ), South Indian Ocean, and the South America. Bottom: Difference in the Jan/Feb mean rainfall 1999 minus 1998. During ENSO warm event (El Niño) in 1998 central Pacific rainfall is anomalously high, and west Pacific rainfall is anomalously low.
Consider what would happen next if any of the following occurred: The Trade winds weakened Central Pacific SST warmed Rainfall increased in the central Pacific
Consider what would happen next if any of the following occurred: The Trade winds weakened … * equatorial upwelling would slow down* SST would rise in the central Pacific* atmospheric convection would occur more quickly* the region of precipitation would move to the east closing the Walker cell sooner … weakening the Trade winds in the west A positive feedback that amplifies initial the Trade wind weakening
Consider what would happen next if any of the following occurred: 2. Central Pacific SST warmed … * atmospheric convection would occur more toward the east * the region of precipitation would move to the east closing the Walker cell sooner * weakening the Trade winds * equatorial upwelling would slow down* SST would rise in the central Pacific
Consider what would happen next if any of the following occurred: 3. Rainfall increased in the central Pacific … * the Walker cell would close more toward the east * weakening the Trade winds * equatorial upwelling would slow down* SST would rise in the central Pacific* atmospheric convection and rainfall would occur more toward the central than western Pacific
There is some evidence that a trigger for ENSO warm events might be westerly wind bursts in the western equatorial Pacific. • A wind burst such as this sets in train wave motions that are characteristic of the equatorial region. • The westerly wind burst causes: • converging Ekman transports (off equator) that increase sea level • and depress the thermocline • eastward geostrophic flow converges to the east • and diverges to the west • the pattern moves eastward • Note that the same happens for an easterly wind burst: the equatorial Kelvin waves only go east so the anomalous pattern cannot easily reset itself even if the WWB is followed by easterly wind anomalies. • The equatorial Kelvin wave speed Explain Kelvin wave dynamics and westerly wind anomaly is about 2.5 m/s (roughly ~200 km/day) The observed speed is about 10 – 20% faster than this due to advection by the EUC
http://www.pmel.noaa.gov/tao/elnino/nino-home.html Present conditions: Format size 75% http://www.pmel.noaa.gov/tao/jsdisplay http://iridl.ldeo.columbia.edu/maproom/.ENSO/.Time_Series/SOI.html NOAA ENSO Advisory: http://www.cpc.ncep.noaa.gov/products/analysis_monitoring/enso_advisory/ensodisc.html
Fig 1. Average sea surface temperature (SST) anomalies (oC) for the week centered on 28 August 2013. Anomalies are computed with respect to the 1981-2010 base period weekly means. NOAA ENSO Advisory: http://www.cpc.ncep.noaa.gov/products/analysis_monitoring/enso_advisory/ensodisc.html
Next: upper ocean heat content … Fig 2. Time series of area-averaged sea surface temperature (SST) anomalies (oC) in the Niño regions. Anomalies are departures from the 1981-2010 base period pentad means.
Fig 3. Area-averaged upper-ocean heat content anomaly (oC) in the equatorial Pacific (5oN-5oS, 180o-100oW). The heat content anomaly is computed as the departure from the 1981-2010 base period pentad means. Fig 4. Depth-longitude section of equatorial Pacific upper-ocean (0-300m) temperature anomalies (oC) centered on the pentad of 31 August 2013. The anomalies are averaged between 5oN-5oS. Anomalies are departures from the 1981-2010 base period pentad means.
Low-level and upper-level winds were near average across the equatorial Pacific. Convection was enhanced over Indonesia and suppressed in the central and eastern Pacific (Fig. 5). Collectively, these atmosphere & ocean conditions reflect ENSO-neutral. Fig 5. Average outgoing longwave radiation (OLR) anomalies (W/m2) for the four-week period 1-26 August 2013. OLR anomalies are computed as departures from the 1979-1995 base period pentad means
Most models predict ENSO-neutral (Niño-3.4 index between -0.5oC and 0.5oC) into the Northern Hemisphere spring 2014. • For the next several seasons, the average of the statistical model forecasts is near -0.5oC, while the average of the dynamical model forecasts is near or just above 0.0oC. • The forecast consensus favors ENSO-neutral (60% chance or greater) through Dec to Feb. Fig 6. Forecasts of sea surface temperature (SST) anomalies for the Nino 3.4 region (5oN-5oS, 120Wo-170oW). Figure courtesy of the International Research Institute (IRI) for Climate and Society. Figure updated 13 August 2013


![[PDF] Free Download A Drop in the Ocean By Jenni Ogden](https://cdn4.slideserve.com/8372290/slide1-dt.jpg)