Download
1 / 26
260 likes | 342 Views
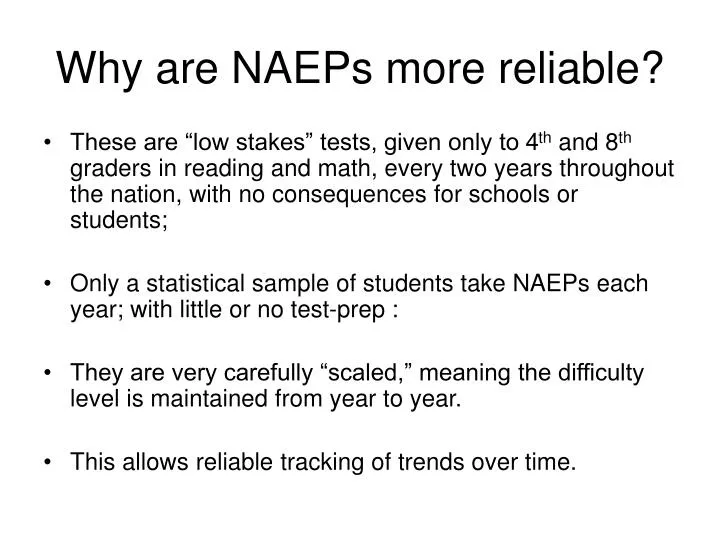
Why are NAEPs more reliable?. These are “low stakes” tests, given only to 4 th and 8 th graders in reading and math, every two years throughout the nation, with no consequences for schools or students; Only a statistical sample of students take NAEPs each year; with little or no test-prep :

E N D
Why are NAEPs more reliable? • These are “low stakes” tests, given only to 4th and 8th graders in reading and math, every two years throughout the nation, with no consequences for schools or students; • Only a statistical sample of students take NAEPs each year; with little or no test-prep : • They are very carefully “scaled,” meaning the difficulty level is maintained from year to year. • This allows reliable tracking of trends over time.
More myth and realityfrom Joel Klein • “In fourth grade, NYC’s performance [on the NAEPs] now matches that of the nation as a whole, even though NYC serves a much more challenging population.” (Joel Klein, letter to principals, Sept. 3, 2010) • “That’s called “closing the achievement gap.” • Neither of these claims are true.
NYC 4th grade NAEP scores do not match nation as a whole. • Average NYC score of 217 for reading in 2009 was at the 44th percentile for the nation. • Average score of 237 for math was at the 46th percentile for the nation. (Source: The Nation’s report card; Reading and Math 2009, Trial Urban District Assessment, National Center for Education Statistics.
“Achievement gap” means gap in test scores between ethnic and racial groups Reality:According to the NAEPs, NYC has not significantly narrowed the achievement gap in any category or grade since 2003, either Black/white or Hispanic/white, when the Chancellor’s policies were first implemented.
Another MYTH: “For all students citywide, fourth-grade NAEP scores have [been] substantially outpacing students … around the nation.” (Joel Klein, NY Post oped, 8/20/10) Reality: • Since 2003, in 4th grade reading, NYC students have made significantly smaller gains than one city (DC) significantly larger gains than another (Cleveland) with no statistical difference than the seven other cities tested over this period. • In 4th grade math, NYC has made significantly smaller gains than two cities (DC and Boston), larger gains than three (Charlotte, Cleveland and LA) with no statistical difference than the four other cities tested over this period.
How about 8th grade NAEPs? • Since 2003, in 8th grade reading, NYC students have seen less growth in test scores than two cities (LA and Atlanta) and no sign. difference than 7 other cities. • In 8th grade math, NYC students have seen less growth than five other cities (Atlanta, Boston, Houston,LA and San Diego) and no sign. difference in four more.
NAEP Score Growth from 2003-2009: NYC vs. Other Urban Districts NYC grew less NYC grew more No difference Slide courtesy of Prof. Aaron Pallas Slide courtesy of Prof. Aaron Pallas
NYC only city among ten tested over this period to make NO progress in 8th grade reading.
According to NAEPs, relative ranking of average NYC black student scores fell in every grade and subject from 2003-2009, compared to other large cities . • 4th grade math; NYC black students were in 2nd place in 2003; by 2009, were tied for third place among cities over this period. • 4th grade reading; NYC black students were tied for 3rd place, fell to 4th place in 2009. • 8th grade math: NYC black students were in 3rd place in 2003, fell to 5th place by 2009. • 8th grade reading: NYC black students tied for 2nd place in 2003; tied for 3rd place by 2009
For Hispanic students, relative ranking also fell in NYC in every grade and subject, from 2003-2009, compared to other cities. • 4th grade math: in 2003, NYC Hispanic students were tied for third place among large cities; in 2009, they fell to 4th place. • 4th grade reading, NYC Hispanics were in 1st place in 2003, fell to 3rd place. • 8th grade math: Hispanics were in 3rd place in 2003; fell to 7th place. • 8th grade reading: Hispanics were in 2nd place and fell to 6th place.
DOE claims great progress for low-income students but the reality is different… • NYC free-lunch students already ranked #1 in average NAEP scale scores in 2003 among all cities tested; • By 2009, in 4th gr. reading, NYC free lunch students still #1, but had made smaller gains than DC, Charlotte & Atlanta; • In 8th grade reading, NYC fell from #1 to #2; and made smaller gains than LA, Houston, Boston, & Atlanta; • In 4th grade math, NYC still #1, but made smaller gains than Boston; • In 8th grade math, NYC fell from #1 to #3, and made smaller gains than SD, LA, Houston, Charlotte, Boston, and Atlanta.
For non-free lunch students, NYC has worst record of any city in math 2003-2009 • In 4th grade math, non-poor students started out as #2 among all cities tested in 2003, but fell to #5 by 2009; • In 8th grade math, started out as #1, but fell to #5 by 2009; • NYC was the only city in the country in which 8th grade math scores fell among non-poor students between 2003- 2009. • And their average score fell 10 points!
In reading, NYC also has by far worst record of any city w/ non-free lunch students between 2003-2009 • In 4th gr. reading, NYC was only city in which non-poor students hadlower average scores in 2009; and fell from 1st to 3rd place in this category; • In 8th gr. reading, NYC was only city in which non-poor students hadlower average scores in 2009, and had fallen from #1 to sixth place!
City also claims rising graduation rates Here too, we see Campbell’s law in action • Questions on state Regents exams and passing scores needed for graduation have become much far easier, just like K-8 exams • High school staff scores their own Regents exams; the practice of “scrubbing” to raise scores to passing level openly encouraged, and principals are allowed to change scores if teachers do not pass students. • The more students a teacher/principal passes, the higher the grade your school receives; and the more likely you are to receive a bonus and/or keep your job; • Incentives clear: pass as many students as possible! Wouldn’t you?
If that’s not enough… • Practice of “credit recovery” spreading like wildfire in city schools, esp. online credit recovery; • Virtual learning w/ software programs where students can gain credits needed to graduate in a few weeks, despite failing all their courses and/or not attending class, • Students commonly answer multiple choice questions while looking up responses online; and cut and paste in answers. • No “seat time” required and can be done at home w/ no adult supervision. • Effect: many NYC high schools becoming “diploma mills”
Also… thousands of students are discharged each year from NYC schools and not counted as dropouts • Discharge category the “black hole” of DOE accounting. • The higher the discharge rate, the higher the school’s graduation rate, as these students removed from cohort. • Number and rate of students “discharged” to other schools and/or GED programs (or perhaps nowhere at all) has been rising. • Under this administration, the percent of students discharged in their first year of HS has doubled. • The last year for which we have complete data (the class that should have graduated in 2007) there were 20,488 students discharged from NYC high schools.
Source: HIGH SCHOOL DISCHARGES REVISITED: TRENDS IN NEW YORK CITY’S DISCHARGE RATES, 2000-2007 JENNIFER L. JENNINGS and LEONIE HAIMSON, APRIL 2009. 2009
Clearly, test-based accountability systems do not improve schools; so what should we do instead? • Reduce class size, which would also have following beneficial effects: • Lowering teacher attrition, leading to more experienced workforce; • Increasing parental involvement and input at the school level; • Unfortunately, DOE is implementing none of these reforms.
Class Size • Reducing class size is only of only four K-12 reforms that is backed by “rigorous evidence” according to the Institute of Education Sciences, research arm of US Dept. of Education.* • Proven effect in narrowing the achievement gap; • NYC has by the far the largest class sizes in state; • In CFE case, NY State Court of Appeals said that NYC students were deprived of their constitutional right to an adequate education because of excessive class sizes; • Yet class sizes have increased the last two years at an unprecedented rate; and are expected to increase again this year, due to 2,000 lost teaching positions and 18,000 more students. * Other three K-12 evidence-based reforms, acc. to IES, include one-on-one tutoring by qualified tutors for at-risk readers in grades 1-3, Life-Skills training for junior high students, and instruction for early readers in phonemic awareness and phonics.
What’s happening this year? • This year, some Kindergartens are up to 30 students per class; some 1st grades are up to 34; • Even so, DOE refusing to use $200 million in federal edujobs funding awarded NYC to address this problem • Also DOE has wasted nearly $1 billion in state funds, since 2007, provided in exchange for their promise to reduce class size in all grades.
Conclusion: • DOE has a moral and a legal obligation to reduce class size. • Instead, the administration is imposing a high-stakes accountability system that is unreliable and unfair. • It victimizes our high-needs students and their teachers…. • ….and further undermines the quality of education in our public schools.