Download
1 / 37
370 likes | 531 Views
Multimedia Data Introduction to Image Processing . Dr Mike Spann http://www.eee.bham.ac.uk/spannm M.Spann@bham.ac.uk Electronic, Electrical and Computer Engineering. Image Processing Content. Image histograms, histogram equalization and image frequency content. Low level image processing

E N D
Multimedia DataIntroduction to Image Processing Dr Mike Spann http://www.eee.bham.ac.uk/spannm M.Spann@bham.ac.uk Electronic, Electrical and Computer Engineering
Image Processing Content • Image histograms, histogram equalization and image frequency content. • Low level image processing • Brightening, darkening, thresholding and quantizing • Simple filtering examples • Simple low-pass and high-pass filters • Median filtering • Examples and demonstrations will be included in the lecture session.
Histogram Equalization • Histogram equalization can be very useful for improving image contrast by spreading pixel values across the full dynamic range. • Ideally, pixels would use a wide range of values. • See the underexposed photograph on the left. Its image histogram shows that the intensity values have a compact range between mid to light grey. • The histogram equalized photograph on the right has better contrast. Its histogram has the same shape as the original but is stretched across the full range of intensity values.
Histogram Equalization • Examples from http://rst.gsfc.nasa.gov/Sect1/Sect1_12a.html Left: a low contrast original image. Middle: the image after linear equalization. Right: the image after selected emphasis to a range of values of interest. Low contrast Higher contrast Selective high contrast
Image Histograms • We can look at a simple and efficient algorithm to perform image equalisation • But first we need to formally define what me mean by a histogram and how we compute it across an image • The histogram h(i) of a grey scale image is simple the number of pixels with greylevel equal to i • In effect h(i) is an array with 256 entries for an 8 bit greyscale image • One simple thing we can say about the histogram is that if we add up all the entries, we will get the number of pixels in an image • We can compute other more interesting measurements from the histogram
Image Histograms • It is easy to count the numbers of pixels at different intensity values to produce histograms. • These histograms give us useful information about the dynamic range of the image data. • The wider the spread of pixel intensities the higher the contrast. Light image Dark image Number of pixels Intensity High-contrast image Low-contrast image
Computing the Histogram foreachi=0..255 hist(i)=0 foreach pixel (x,y) i=image(x,y) hist(i)=hist(i)+1 • There is a simple and efficient way of computing the histogram • Just involves a single sweep through the image • We can describe the algorithm in pseudo-code • Easy to translate into C or any other programming language
The Histogram Equalisation Algorithm • The histogram equalisation algorithm is a simple method of increasing the contrast in an image • The histogram of a low contrast image occupies a narrow range of possible greyscale values • We want to stretch (equalise) the histogram such that it occupies the full range of possible greyscale values • Based on a ‘lookup’ function g(i) i g(i) g(i) i
The Histogram Equalisation Algorithm • A ‘lookup’ function (or table) g(i) is a simple input -> output mapping • Very efficient to implement in hardware or software • It is a set of stored number indexed by the input i • g(i) defines the mapped output of input i
The Histogram Equalisation Algorithm • We need to design a lookup function g(i) that ‘stretches’ the dynamic range of grey levels in the image histogram • We have to think carefully about g(i) as, after applying it, the histogram still has to meet it’s constraints • Simplest constraint is that the histogram of the image after applying the lookup function must still ‘contain’ N2pixels (for an N x N image)
The Histogram Equalisation Algorithm • The second constraint is more subtle • We don’t want to create an image that looks like a photographic negative • Grey levels can’t cross when we apply the lookup function • Mathematically we can write this as : A ‘legal’ lookup function
The Histogram Equalisation Algorithm • Before we describe the algorithm we need to define one other simple image measure related to the histogram h(i) • The cumulative histogram H(i) • H(i) is defined as the number of pixels with grey level less than or equal to i. • It’s easy to compute H(i) from h(i) • Just add up the histogram entries up to and including the ith • Mathematically: • We also know that: • Since computing the histogram is very efficient, so is computing the cumulative histogram • We will see how our lookup function g(i) is simply defined in terms of H(i)
The Histogram Equalisation Algorithm • We can now derive the lookup function which performs our histogram equalisation • Let the actual histogram and cumulative histogram be h(i) and H(i) • Let the desired histogram and desired cumulative histogram be h’(i) and H’(i) • Let the transformation be g(i) • The ‘optimum’ h(i) is a constant occupying the full dynamic range of grey levels • This makes the ‘optimum’ corresponding H(i) a ramp function H’(i) h(i) i g(i) g(i) H’(i) h’(i)
The Histogram Equalisation Algorithm • We can now derive the histogram equalisation algorithm • We apply the key constraint of non-crossing over of grey levels after application of g(i) • Gives us the final expression for g(i) in terms of H(i)
0 197 197 1.351 - Worked example 1 256 453 3.103 197 2 212 665 4.555 - 3 164 829 5.676 256 4 82 911 6.236 - 5 62 993 6.657 212 6 31 1004 6.867 246 7 20 1024 7.07 113 • A simple worked example will show how we apply g(i) • 32 x 32 bit image with grey levels quantised to 3 bits • We can see from the last column how the histogram occupies a much wider band of grey levels
Histogram Equalization • ImageJ demo • http://rsb.info.nih.gov/ij/signed-applet/
The image histogram tells us nothing about the distribution of pixel intensities in an image. For example, a “U” shaped histogram with peaks around black and white values could be either of the images below. We can refer to the frequency content of an image. Smooth areas are low frequency. Edges and other rapid changes are high frequency. Frequencies in Images increasing frequency These images have the same histogram. increasing frequency
Signals are often efficiently represented by the addition of simple sine or cosine waves. But there’s a problem. If we try to create a SQUARE shaped wave using these simple waves, the ripples never go away. As we add smaller and smaller amounts of higher frequency sine waves we still have ripples. The animation on the right shows the result of adding sine waves of higher and higher frequency. The sine wave is shown on the top and the sum of all the waves is shown on the bottom. See how a rippled square shaped signal appears. Images often contain many sharp edges just like the square wave. You can often see these rippling or ringing artefacts about edges in heavily compressed images and video. Frequencies in Images http://www.numerit.com/samples/fours/doc.htm Demonstration of ringing www.utdallas.edu/~dxa081000/IMAGEFILTERING.ppt
We can adjust the amount of frequencies in signals and images. Low-pass filtering preserves (passes) lower frequencies but drops higher frequencies. High-pass filtering preserves (passes) higher frequencies but drops lower frequencies. Both high- and low-pass filters have their uses. Low-pass filters can remove noise from poor quality images by smoothing. High-pass filters can usefully pick out edges. Filtering Frequencies Original After low-pass filtering. Appears smooth or blurred. After high-pass filtering. Edges remain.
Aliasing • We have a fixed pixel spacing which defines the spatial sampling frequency • We need to sample at a rate of at least twice per cycle of highest frequency signal in the image • Nyquist’s theorem • If we don’t we get ‘low frequency wraparound’ which produces artefacts in the image
Aliasing • Below are a few examples of aliasing in images
Image Processing • Low-level • working at the pixel level, identification of edges • Medium-level • identification of regions and shapes • High-level • associating shapes with real objects. Low Medium High
Low-level Image Processing Examples Adjusting brightness • To lighten or darken images we can simply add or subtract a constant value from all pixel values. Thresholding • Used to remove grey-levels in an image or segment components. • It involves changing pixel values if they are above or below a certain value (threshold). • For example, setting all pixel values below a threshold to zero and/or above a certain value to a maximum. Example of simple thresholding Before : top After : below (threshold = 180)
Thresholding • Thresholding is a useful tool is extracting ‘objects’ from images • Enables us then to, for example, measure the size distribution of objects (such as asbestos fibres or cells) • Often applied interactively • ImageJ demo • http://rsb.info.nih.gov/ij/signed-applet/
Operations on Images • Simple image operators can be classified as 'point-wise' or 'neighbourhood' (filtering) operators • Histogram equalisation is a point-wise operation • More general filtering operations use neighbourhoods of pixels • Filtering operations are generally used to extract useful features from images such as edges • Filters come in many shapes and sizes
Image Filtering • The output g(x,y) can be a linear or non-linear function of the set of input pixel grey levels {f(x-M,y-M)…f(x+M,y+M}. • The function used defines the type of filter • Typically filters are classified into linear and non-linear filters • We will look in more detail at linear filters but we will also see an example of a useful non-linear filter A 3x3 filter
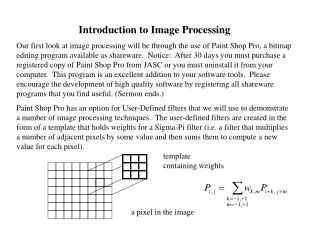
Template Operations • Templates (in this context) are arrays of values. • Here are 3 examples; • They are very useful as simple image filters. • For example, for image smoothing or edge detection.
Template Operations • We apply a template filter to the image using a convolution operation. • Convolution involves moving the template step-by-step over the image creating a window over pixel neighbours. This will be demonstrated in the lecture. • Template and pixel values are used for computation (typically multiplication and addition) at each step. This process is referred to as convolution of the template with the image. • You will see that the new result is smaller than the original. We could avoid this by wrapping edges together (periodic convolution) .
Common Templates • This is a simple 3x3 averaging (smoothing/blurring) template :- • It is an example of a low-pass filter. It passes low frequency and removes high frequency. Left: A low resolution original image. Right: After 3x3 averaging filter. Notice the blurring effect. This is caused by the averaging of pixels across every block of 9 pixels. In a higher resolution image the effects would be less noticeable for such a small filter.
Common Templates • This is a simple high-pass filter. • Both high- and low-pass filters have their uses. • Low-pass filters can remove noise from poor quality images by smoothing. • High-pass filters can detect edges. Horizontal edges, vertical edges and diagonal edges. Simple examples of detected edges. Top left: a low resolution original,Top right: horizontal edges and Below left: vertical edges and Below right: All edges
Examples • ImageJ demo • http://rsb.info.nih.gov/ij/signed-applet/
Median Filtering • Median filtering is useful for removing noise but usefully preserves edges. • The median is the central value in a range • Median {4,2,0,1,3,0,5} = 2 • Median filtering is a popular filtering method. Pixel values are sorted and the median (middle value) is output. • Median filtering removes sparse outliers. • Sparse outliers appear as “salt and pepper” noise in images, i.e., dark pixels in light areas and light pixels in dark areas. This type of noise was common in analogue television. • You will use some simple filters in the laboratory. A median filter will be used to remove noise. Passing a 3x3 median filter over the image pixels shown above on the right produces the output on the right. Notice how the outlier (the 6) is removed.
Median Filtering examples • Median filtering is a useful tool as it can remove image noise but doesn’t interfere with useful image detail • The downside is that, although there are computational ‘speed ups’ that can be applied, there is no equivalent ‘fast’ algorithm to the Fast Fourier Transform (FFT) in linear filtering
Median Filtering • ImageJ demo • http://rsb.info.nih.gov/ij/signed-applet/
This concludes our introduction to image processing. • You can find course information, including slides and supporting resources, on-line on the course web page at Thank You http://www.eee.bham.ac.uk/spannm/Courses/ee1f2.htm