Download
1 / 41
410 likes | 501 Views
Denver Public Schools Financial State of the District 2003 through 2010 Presented to the Board of Education April 6, 2006. Presentation Agenda. 2005-2006 Accomplishments What’s at Stake? Why is Our Budget Broken? DPS Revenues: Where Do We Get Our Money? DPS Expenditures:

E N D
Denver Public SchoolsFinancial State of the District2003 through 2010Presented to the Board of EducationApril 6, 2006
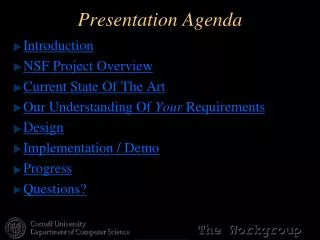
Presentation Agenda • 2005-2006 Accomplishments • What’s at Stake? • Why is Our Budget Broken? • DPS Revenues: Where Do We Get Our Money? • DPS Expenditures: • Where Do We Spend the Public’s Money? • The Real Numbers - Discretionary vs. Non-Discretionary Dollars • How We Have Historically Addressed The Budget Gap • Next Year’s Budget • The Bottom Line • What Happens if We Don’t Address the Bottom Line? • Moving Forward: Strategic Alternatives • Next Steps
2005-2006 Accomplishments • Board Adopted Budget Principles • Consolidated Budget Staff & Budgets • Aligned Budget to The Denver Plan • Completed Budget/Staffing Calendar four weeks earlier than previous years (allowing district to compete with suburban districts) • Increasing Budget Transparency
What’s at Stake? • Student Achievement • Quality of Education Richness in School Environment & Curriculum (Number of Teachers and Other Staff; Class sizes; breadth of Elective offerings) • Competitive Wages for Teachers, Principals, and other Employees
Why is Our Budget Broken? • District Enrollment Declining • Retirement Costs Increasing • Compensation Increases to Remain Competitive Exceed our Revenue Increases • Non-Discretionary Costs Increasing Faster than Inflation • Low Per Pupil Funding Compared To Urban Districts Across the Country
District Enrollment Declining School-Age Children is based on data from the State Department of Local Affairs
Increasing Retirement Costs Board actions in January 2005 and March 2005 will set the pension contribution rate at the actuarial level by July 2008 and level the PCOPs payments by 2008-2009, respectively
Compensation Increases are Over Revenue Increases Over this 7-year period, the cumulative CPI, revenue and compensation increases are 14.1%,23.0% and 35.4%, respectively. NOTE: 2006-07 thru 2009-10 Compensation Increases assumes CPI on salary and benefit allowance, plus steps, educational and longevity increments
General Fund Compensation Increases Over Current Services Budget Over this 7-year period, the cumulative salary/benefit allowance and pension increases are $86.6 millionand$37.5 million, respectively. NOTE: Current Services Budget is the current staffing level before staff cuts to address the budget gap
2005-2006 Full-Time Staff AllocationsAll Funds(6,817.17 FTEs) • Building Administrators:Principals & Asst Principals • Other Administrators: District Management, Business & Central Support Administrators • Certificated: Represented by the DCTA (i.e., teachers, librarians, nurses, psychologists, social workers, counselors, ROTC, etc.) • Other:Includes professional technical, office, contract paraprofessionals, transportation, facility and custodial, security, warehouse, and maintenance personnel • * Does not includehourly paraprofessionals, bus drivers, mechanics, custodians, clerical, etc. personnel
$ in millions Where Do We Get Our Money? Categories of Funds for the 2005-2006 Budget $1.3 Billion * * *Less than .5%
How Much of the Public’s Money is Restricted?Starting with the $1.3B of resources, there are certain funds that are restricted in their entirety : $ in Millions Of this $782.6 million: General Fund = $690.2 million Government Grants Fund = $92.4 million
How Much of the Public’s Money is Restricted?In the General Fund , there are $204.5 Million Restricted Uses : $ in Millions
How Much of the Public’s Money is Restricted?In the Government Grants Fund , there are $72 Million Restricted Uses : $ in Millions
What Money Do We Really Have Discretion Over?Now to Address the $485.6 million (General) + $20.0 (Grants) = $505.6 Million • Schools – expenditures in the schools • Special Ed – itinerant teachers, paras and transportation for special ed students • PCOPs – pension COP payments • Pro-Comp – 2005 pro comp funds • 98/03 ML – other 1998 and 2003 mill levy funds • Post-Retire – Retiree Health Trust and retiree life contributions $505.6 Million x 63% = $315.0 Million Less Schools (54%) of (268.7) Million Everything Else (9%) = $ 46.3 Million • Title I&II – other Title I & II funds • Util/Fuel – utilities, phone/fax and bus fuel • Spec/Lvs/Subs – nurses, psych, soc.workers, paid FMLA leaves and teacher subs
Breakdown of Expenses$505.6 Million $ in Millions * Less than .5% *
What is “Everything Else”? $ in Millions
General Operating FundCauses of Projected Current Services Budget Gap $ in millions Enrollment Reduction excludes charter, contract and on-line students
How We Have Historically Addressed Our Budget Gap $ in Millions 2003-2004 $30.7 million 2004-2005 $24.6 million 2005-2006 $11.8 million 2006-2007 $16.4 million
Next Year’s Budget • $3.0 Million Recurring Cut in Maintenance • $7.5 Million Cut in Administration • $5.6 Million Cut to Schools offset by $1.9 Million in Program Expansions, $1.6 Million in teacher allocations to certain Northeast Schools, and $3.2 Million increase in available Title I dollars • $.3 Million Other Cuts
The Bottom Line We have balanced the budget by cutting services, but we have not meaningfullyaddressed the structural flaws in our fiscal condition, with the exception of the District’s commitment to better manage its retirement costs.
What happens if we do not address the Structural Problems? $ in Millions * This does not include any resources to improve our textbook purchasing to meet national standards or to make any improvement in class sizes.
What are the Assumptions for the Current Services Budget Gapsin 2007-2008 thru 2009-2010 • Revenues: • School Finance Act Funding Formula and Categorical Funding -Average of OSPB and Legislative Council CPI projections for calendar years 2006 thru 2008 (2.55%; 2.75% and 2.85%) + 1% inflation for FY 2007-2008, 2008-2009 and 2009-2010 • Enrollment Projections– Use of Planning’s non-charter/contract enrollment projections for Oct 2007, 2008 and 2009 of decrease of 1104, 1005 and 1047 students, respectively • Specific Ownership Taxes– Increase of $250,000 each year (2005-2006 is the first year in many that has had any increase from this revenue source) • Expenditures: • Current Year Expenditures – Assumes that the prior year’s shortfall was addressed with recurring expenditure cuts • Pension Contribution Rate – From 11.14% for 2006-2007 to 12.81% for 2007-2008 and 14.47% thereafter, per actuary
What are the Assumptions for the Current Services Budget Gapsin 2007-2008 thru 2009-2010 • Expenditures(continued) • PCOPs Lease Payment – Additional $1.45 million for 2007-2008 and level thereafter • PCOPs Refunding – Use of refunding reserves to refund 1997 PCOPs in 12/15/07, the redemption date • Enrollment Changes – Decrease to non-charter schools at the 2006-2007 variable resource allocation per pupil (approximates 50% of School Finance Act per pupil funding) • Other Compensation – CPI for COLA plus, steps, longevity and educational increments, plus salary tail (impact of prior year compensation increases in September and/or January) • One-Time Fixes – restoration of prior years’ annual maintenance expenditure reduction of $3 million in 2007-2008 • Other Expenditure Changes – includes such expenditures as • property/liability insurance premiums (est. 5%); • utilities and fuel (est. 5%); • technology license/maintenance contract fees (est. 10%); • fixed costs for new Stapleton K-8 school in 2008-2009; • statutory increases in pass-thru per pupil funding to charters, facilities, EGOS students; • facilities students excess costs (est. 5%); and • annualized employee turnover savings (est. $5.1 million)
What Happens if we do not address the Structural Problems? $ in Millions By 2009-10, the annual textbook budget will be $8 million over 2006-07 levels to be comparable to our peers; and class sizes will be 3 less 2006-07 levels…some still view as above optimum
What are Some Additional Needs?We Have Heard that There are Other Needs $ in Millions The following are some of the other needs we have heard, which if added, will further exacerbate the budget gap (these are annual costs): • Full-Day Kindergarten– assuming school buildings can accommodate, schools would need an additional $6.5m • ECE Services to all 4-Year Olds– the cost for approximately 2200 4-year olds that are not currently served but are projected to enter kindergarten is $4m • Intervention Teachers – based on the Denver Plan, the cost would be $1m • Librarians - $3.4m is the cost to add a .5 librarian to each elementary, K8, middle and high school • Social Workers - $3.4m is the cost to add a .5 social worker to each elementary, K8, middle and high school • School Nurses - $2.6m would buy us a .5 nurse for each of the 91 elementary and K8 schools • Counselors - $1.6m is the cost to add 1 counselor to each middle and high school • K8: MS Athletics –1st year cost for the 10 K-8 schools not participating is $.5m
$17.5m cut in “everything else” – or 37.8% of the 2005-06 level of $46.3m in everything else (as an example, $17.5m adds up to all non-special ed transportation plus all technology services plus all general administration plus part of security!) $17.5m reduction in compensation – eliminate projected increase of $12.9m and cut current level by $4.6m (this could wipe out all efforts to be competitive with the marketplace) $17.5m increase in class sizes – based on projected enrollment, this would translate into an average increase of 4.5 students per class (elimination of 308 teachers!) . $17.5m net available resource increase from increased enrollment – assuming 50% of per pupil funding is needed for incremental costs, we would need 5,173 more students attending our DPS schools, or a 7.8% increase over the 9/30/05 level. 2007-2008 Hypothetical Ways to address Budget Gap of $17.5 Million $ in Millions
$12.1m cut in “everything else” – for the two years, the cumulative cut of $29.6m would be 63.9% of the 2005-06 level of $46.3m in everything else (as an example, $12.1m adds up to all facilities costs plus all central & business support!) $12.1m reduction in compensation – eliminate $12.1m of $12.9m projected increase (this could wipe out all efforts to be competitive with the marketplace) $12.1m increase in class sizes – based on projected enrollment, this would translate into an average increase of 3.0 students per class (elimination of 212 teachers!) . $12.1m net available resource increase from increased enrollment – assuming 50% of per pupil funding is need for incremental costs, we would need 3,447 more students attending our DPS schools, or a 5.2% increase over the 9/30/05 level. 2008-2009 Hypothetical Ways to address Budget Gap of $12.1 Million $ in Millions
$12.6m cut in everything else – for the three years, the cumulative cut of $42.2m would be 91.1% of the 2005-06 level of $46.3m in everything else (as an example, this additional $12.6m adds up to all academic support plus all half of human resources; leaving only part of security and part of human resources and nothing else!) $12.6m reduction in compensation – eliminate $12.6m of $13.8m projected increase (this could wipe out all efforts to be competitive with the marketplace) $12.6m increase in class sizes – based on projected enrollment, this would translate into an average increase of 3.2 students per class (elimination of 221 teachers!) . $12.6m net available resource increase from increased enrollment – assuming 50% of per pupil funding is need for incremental costs, we would need 3,457 more students attending our DPS schools, or a 5.2% increase over the 9/30/05 level. 2009-2010 Hypothetical Ways to address Budget Gap of $12.6 Million $ in Millions
2007-2008, 2008-2009 and 2009-2010 Cumulative Hypothetical Effect to address Budget Gap Assuming the entire budget gap was accomplished by one of these strategies • “Everything Else” - $42.2m cut from the $46.3m level in 2005-2006, or 91.1%; “everything else” becomes “nothing else” • Compensation – assuming other school districts granted traditional comp increases, we would be $42.2m below everybody else • Class Sizes – to cut $42.2m, we would need to increase class sizes on average by 10.7, or eliminate 741 teachers • Increase Enrollment – to increase net available resources by $42.2m, we would need to add 12,077 students, or 18.2% more than the 9/30/05 level of students attending our DPS schools
Presentation Summary To address the structural flaws in our financial flaws in our fiscal condition, we could either take the: • Traditional Paths to reducing our budget gaps through cuts in Compensation – making us utterly non-competitive in the market place School Resources –degrading our schools and repelling students and parents Erase “Everything Else” – eliminating all operational support and accountability OR • Systematic Reform Paths to reducing our budget gaps through Increase revenues with increased enrollment – we have available capacity and competitive offerings Consolidate and strengthen our academic offerings into fewer, better schools
Increase Revenue by Increasing Enrollment • Market our existing competitive programs in our schools • Create schools and academic programs that are compelling educational choices for parents and students • Work with school communities to ensure neighborhood school choices reflect both high academic expectations and community interests • Support schools to better tell their stories in their respective communities • Reward schools that attract and retain students • Reward and recognize schools that achieve distinguished academic results • Provide innovation grants to schools that submit meritorious proposals that promise to improve their academic results and increase student enrollment • NEXT STEPS – Convene awork group by mid-May to conduct market research and develop strategy for attracting and retaining students in DPS schools
Examine the District’s Fixed Costs • Consolidate and strengthen our academic offerings into fewer better schools • Address the District’s fixed costs to serve the academic needs of our 21st century student population in our new, competitive environment • Evaluate our buildings based on current performance, quality of physical plant, current use, potential enrollment (now and in the future), etc. • NEXT STEPS – Convene a broad-based blue ribbon citizen’s committee by mid-May to address district facilities and recommend where to consolidate some of our buildings and create a richer academic environment
Definitions of Types of Expenditures • Salaries/Benefits – gross salaries for full-time and part-time employees plus the District’s payment of pension contributions & PCOPs, benefit allowances, unemployment and worker’s compensation claims, social security and Medicare taxes, accrued sick leave upon retirement, and contributions to post-retiree health and life insurance • Purchased Services – independent contractor services and other services contracted out or purchased by the District; e.g., tax collection fees, water and sewer fees, tuition payments, property and liability insurance, and payments to charter and contract schools • Supplies – consumable materials, such as textbooks, paper and office supplies, custodial supplies, maintenance parts, fuel for vehicles, electricity, natural gas and the like • Property – amounts paid for acquisition and construction of fixed assets, land and real property • Interfunds/Indirect/Other – transfers between funds (e.g., General Fund to Capital Reserve Fund); indirect cost reimbursements from the Colorado Preschool Program and federal grants to the General Fund; and other expenses such as registration fees • Debt –annual principal and interest payments on outstanding general obligation bonds and capital certificates of participation • Reserves – reserves held for bond redemption, food service operations, capital programs, TABOR compliance, contingencies, trust and mill levy designated purposes
District Fund Definitions Sixteen individual funds (General Funds includes 4 sub-funds) – State budget law; self-balancing • General Operating Fund – sub-fund of the General Fund that is used for general operations. This Fund is the Focus of the Presentation – other funds are restricted as to use. • 1998 Mill Levy Override Fund – sub-fund of the General Fund; November 1998 voter-approved mill levy override for student literacy, computers in schools and deferred building maintenance • 2003 Mill Levy Override Fund - sub-fund of the General Fund; November 2003 voter-approved mill levy override for arts/music teachers in all elementary schools, textbooks, repairs and maintenance, all-day kindergarten and early education, improve high school graduation rates, and improve academic achievement in under-performing schools • 2005 Mill Levy Override Fund – sub-fund of the General Fund; November 2005 voter-approved mill levy override for the professional compensation system for teachers • Government Designated Purpose Grants - local, state + federal grants + EGOS
District Fund Definitions • Special Revenue - non-government grants, tuition-based + fee-based programs, federal e-rate and local enterprise activities • Pupil Activity - high school athletics; gate receipts + pay-to-play + GF support • Bond Redemption - separate mill levy for general obligation bond (GOB) debt • Building- GOB proceeds + earnings for capital projects (ballot question) • Capital Reserve - 1996 COP lease payments, vehicle + large equipment acquisition, equipment + building maintenance, DURA funded schools, 2003 COP proceeds for northeast school buildings improvements • Food Services - student breakfast + lunch programs funded by federal government + food sales • Self-Insurance - property + liability insurance + worker's comp premiums + claims within deductibles and risk management services – purchased by other District funds • Warehouse/Reproduction Internal Service - class max + digi-pro services purchased by schools + departments
District Fund Definitions • DoTS Service Bureau Internal Service - reimbursable enterprise activities • Maintenance Internal Service - reimbursable services for schools and departments • Custodial Internal Service - floater staff to address school vacancies • Private Purpose (Trust) - funds not for DPS; benefit individuals or other organizations (COBRA, retiree health and life subsidies, DCTA & Paraprofessionals education trusts) • Government Permanent - endowed funds; restricted use of earnings • Student Activity - school sponsored activities (student clubs, etc.)
Everything Else Definitions • Facilities & Building Maintenance- facility services, maintenance, districtwide custodial support , facility construction services • Other Transportation – all pupil transportation excluding special education • Safety & Security – all building-based security, 24/7 patrols, dispatch and investigative services • Central & Business Support – budget & finance, disbursing, accounting, payroll, fixed assets, purchasing, warehouse, digipro services, central ROTC services and grants management • Chief Academic Officer Support – CAO Office, misc. School support, curriculum and instruction. planning/assessment and research, Balarat, CTE Office, English language acquisition, GT Office, community partnerships, area offices and student services • Human Resources – personnel services and employee benefits office • Technology Services – all districtwide technology services excluding software/hardware licenses, fax and telephone services, and federal E-Rate match • General Administration – Superintendent’s Office, legal services and communications office
Estimated Savings from Closing Schools For the smaller schools in the following levels, the estimated annual savings from “moth-balling” a school is: • Elementary School- $350,000 • Middle School - $890,000 • High School - $1,300,000 The above savings include, depending upon the school level, the cost of the following • types of staff: principal, assistant principal, incremental supplemental teacher and paraprofessional, incremental student service day, GT support, librarian, counselor/student advisor, secretarial/clerical staff, facility manager, custodial and • types of other costs: custodial supplies, counselor extra pay, and utilities