Download
1 / 5
50 likes | 159 Views
Genomics. Explosion of genomic data from gene sequence projects. Current emphasis lies in extracting meaningful information from these huge data sets. Methods employed are Clustering and Classification Association Rule Mining may derive meaningful rules from microarray expression data.

E N D
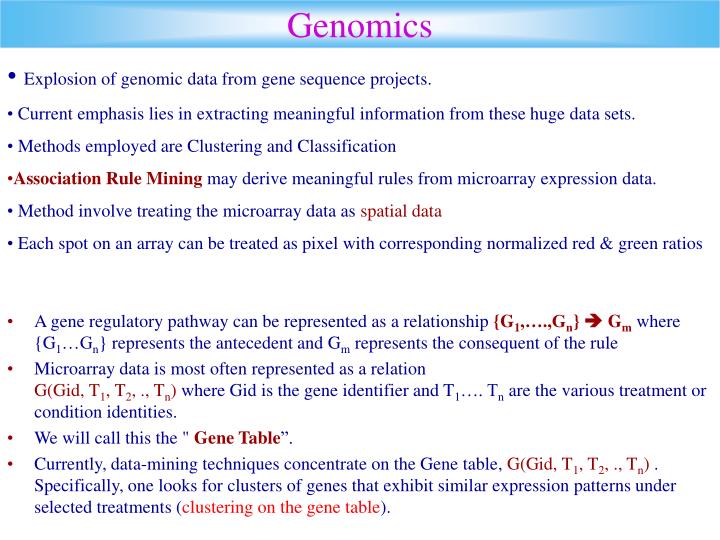
Genomics • Explosion of genomic data from gene sequence projects. • Current emphasis lies in extracting meaningful information from these huge data sets. • Methods employed are Clustering and Classification • Association Rule Mining may derive meaningful rules from microarray expression data. • Method involve treating the microarray data as spatial data • Each spot on an array can be treated as pixel with corresponding normalized red & green ratios • A gene regulatory pathway can be represented as a relationship {G1,….,Gn} Gm where {G1…Gn} represents the antecedent and Gm represents the consequent of the rule • Microarray data is most often represented as a relation G(Gid, T1, T2, ., Tn) where Gid is the gene identifier and T1…. Tn are the various treatment or condition identities. • We will call this the " Gene Table”. • Currently, data-mining techniques concentrate on the Gene table, G(Gid, T1, T2, ., Tn) . Specifically, one looks for clusters of genes that exhibit similar expression patterns under selected treatments (clustering on the gene table).
Gene Table Gene expression values
Treatment Table Gene expression values There is another data format called the “Treatment Table”. T(Tid, G1, G2, …. , Gn) where Tid is the treatment identifier and G1…Gn are the gene identifiers. • Treatment tbl provides a convenient way to treat gene expression levels as spatial data. • Goal is to mine for rules among genes by associating columns(genes) in Treatment tbl • Treatmnt TBL can be organized to new spatial format called bit Sequential-bSQ • Or TT can be viewed as T(Tid, GeneSet) as in MBR • For binary expressions (either the gene expresses at a threshold level (1-bit) or it doesn’t) • All results of MBR can be applied. • To see how microarray data is produced, see the following animation: • http://www.bio.davidson.edu/courses/genomics/chip/chip.html
Data • There is so much data in our lives already. • There is so little information in our lives. • Data Mining attempts to reduce raw data to information for decision support. • Decisions (often 1 bit – Y/N, T/F, Do/Don’t_do ) • Data mining • Classification (supervised learning) • Clustering (unsupervised learning) • Association Rule Mining (ARM) • Statistics • Machine Learning • Data Structuring • Signal Processing • raw data (gigs, teras, petas, exas…) Yes, it will likely cause cancer / No it won’t. 0/1
The Treatment/Gene Table with binary values (coding expression level exceeds / not_exceeds a threshold), the data is identical to Market Basket Data, for which a wealth of Rule Mining techniques have been developed in the last 5 years. Gene Table Treatment Table G1 G2 G3 G4 T1 T2 T3 T4 T1 … …. …. … G1 … …. … … T2 … …. …. … G2 … …. … … G3 … …. … … T3 … …. …. … G4 … …. … … T4 … …. …. … The standard spreadsheet of gene expression levels is a 2-D data cube which can be rotated, rolledup, sliced, diced, drilled down, etc.