Download
1 / 32
330 likes | 502 Views
5.3 WEATHER FORECASTING. Air Movement. The movement of air caused by the differences in air pressure is called wind . The greater the pressure difference, the faster the wind moves. Air moves from areas of HIGH pressure into areas of LOW pressure. Air Movement.

E N D
Air Movement • The movement of air caused by the differences in air pressure is called wind. • The greater the pressure difference, the faster the wind moves. • Air moves from areas of HIGH pressure into areas of LOW pressure.
Air Movement • Differences in air pressure are caused by an unequal heating of the Earth. • Equator receives more direct sunlight per year than other latitudes, so air at equator is warmer = less dense. • Warm, less dense air rises and creates areas of LOW pressure. • At the poles, air is cooler = more dense • Cool, more dense air sinks creating areas of HIGH pressure.
Convection Cells & Pressure Belts • Air travels in large circular patterns called convection cells. • Separated by pressure belts, bands of high pressure and low pressure found about every 30° of latitude. • The combination of convection cells and the Coriolis effect produces patterns of air circulation called global winds.
Global Winds • Polar Easterlies: wind belts extending from the poles to 60° latitude in both hemispheres. • Westerlies: wind belts found between 30° and 60° latitude in both hemispheres. • Trade Winds: winds blowing from 30° latitude almost to the equator in both hemispheres. • Doldrums: the meeting place of the trade winds from both hemispheres around the equator; area of low pressure. • Also known as the Intertropical Convergence Zone, or the ITCZ. • Horse Latitudes: winds located at about 30° north and 30° south latitude; area of high pressure. • According the legend, this name was given to these areas when sailing ships carried horses to Spain and would occasionally throw the horses overboard into the sea.
Jet Streams • A flight from Seattle to Boston can be 30 minutes faster than the flight from Boston to Seattle. WHY? • Pilots take advantage of the jet stream, a narrow belt of high-speed winds blowing in the upper troposphere and lower stratosphere. • Do not follow regular paths. • Jet streams also affect the movement of storms.
Local Winds • Move short distances and can blow from any direction. • Local features like shorelines and mountains can produce temperature differences causing these local winds.
Air Masses • Changes in weather are caused by the movement and interaction of air masses. • An air massis a large body of air where temperature and moisture content are similar throughout. • The temperature and moisture content of an air mass are determined by the area over which the air mass forms, or its source region. • Example: Gulf of Mexico warm and wet because the area is warm and has a lot of water evaporating from the region. • Different types of air masses are represented by a two-letter symbol. • First letter = moisture content • mfor maritime (forms over water, wet) • c for continental(forms over land, dry) • Second letter = temperature • Pfor Polar (forms over polar regions, cold) • T for Tropical (forms over the tropics, warm)
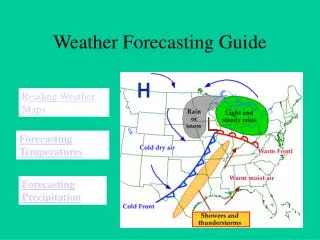
Fronts COLD • Air masses forming from different areas often do not mix. • Due to different densities. • WARM air is less dense (lighter) than COLD air. • The area where two types of air masses meet is called a front. • Four kinds of fronts include cold, warm, occluded, and stationary. WARM OCCLUDED STATIONARY
Fronts • COLD • Forms where cold air moves under warm air, which is less dense, and pushes the warm air up. • Can move quickly and bring thunderstorms, heavy rain, or snow. • Cooler weather usually follows a cold front because the air mass behind the cold front is cooler and drier than the air mass it is replacing. • WARM • Forms where warm air moves over cold, more dense air and gradually replaces it. • Generally bring drizzly rain and are followed by clear, warm weather.
Fronts • OCCLUDED • Forms when a warm air mass is caught between two colder air masses. • The coldest air mass moves under and pushes the warm air mass up. • Moves forward until it meets the other cold air mass which is slightly warmer, therefore slightly less dense. • The cold air masses may occasionally mix together. • Generally bring cool temperatures and large amounts of rain and snow. • STATIONARY • Forms when a cold air mass meets a warm air mass. Move slowly or not at all. • Do not have enough force to lift the warm air mass over the cold one so they remain separated (lack of wind). • Generally bring cloudy, wet weather.
Air Pressure and Weather • Areas having lower pressure than the surrounding areas are called cyclones. • Air masses come together (converge) and rise. • Areas having a higher pressure than surrounding areas are called anticyclones. • Air masses split apart (diverge) and sink. • The sinking, denser air moves out of the centers of these high pressure systems and into areas of low pressure.
Convergence aloft Divergence aloft Divergence at surface Convergence at surface
Air Pressure and Weather • How do cyclones and anticyclones affect the weather? • As the air in the center of a cyclone rises, it cools and condenses to form clouds, which produce precipitation. • In an anticyclone, the air sinks, gets warmer, and absorbs moisture. This brings dry, clear weather. • By keeping track of cyclones and anticyclones, meteorologists are able to accurately predict the weather for a particular area. Jeff Verszyla KDKA Chief Meteorologist
Weather Forecasting • To accurately forecast the weather, meteorologists need to measure various atmospheric conditions including: • To do this, they use special instruments to collect this data both near and far above Earth’s surface. Air Pressure Temperature Humidity Wind Speed Precipitation Wind Direction
High in the Sky • Weather balloons carry electronic equipment used for measuring weather conditions as high as 30 km. above Earth’s surface.
Measuring Air Temperature and Pressure • A tool used to measure air temperature is called a thermometer. • Most use a liquid (alcohol) sealed in a narrow glass tube. • When air temperature increases, the liquid expands and moves up the glass tube. When it decreases, the liquid shrinks and moves down the tube. • A barometer is an instrument used to measure air pressure. • A mercurial barometer consists of a glass tube sealed at one end, placed in a container full of mercury (Hg) which will either rise or fall with changes in air pressure. • An aneroid barometer contains a closed vessel called an aneroid cell, which contracts or expands with changes in air pressure.
Measuring Wind Direction • Wind direction can be measured by using one of the following devices: • Windsock: cone-shaped cloth bag open at both ends. • Wind enters the bag through the wide end and leaves through the narrow end. • Therefore, the wide end points into the wind. • Wind Vane: a device shaped like an arrow with a large tail; attached to a pole. • As the wind pushes the tail of the wind vane, it spins on the pole until the arrow points into the wind.
Measuring Wind Speed • An instrument used to measure wind speed is called an anemometer, which consists of three or four cups connected by spokes to a pole. • The wind pushes on the hollow sides of the cups and causes the cups to rotate on the pole. • The motion sends a weak electric current which is measured and displayed on a dial.
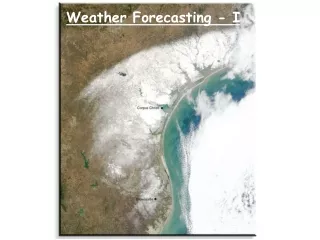
Radar and Satellites • Radar is a measuring system used to find the location, movement and amount of precipitation. It can also detect what form of precipitation a weather system is carrying. • Example: Doppler radar used in a local TV weather report (based on the Doppler Effect: change in frequency as objects move toward a source). • Weather satellites orbiting the Earth can also provide images of weather systems in order to track storms and measure certain conditions.
Weather Maps • In the United States, the National Weather Service (NWS) and the National Oceanic and Atmospheric Administration (NOAA) collect and analyze weather data. • The NWS produces weather maps based on information gathered from about 1000 weather stations across the US. • On these maps, each station is represented by a station model, which is a small circle showing the location of the weather station. • Various symbols surround these station models, all representing specific weather data. • 1.15 mph = 1 knot
Weather Maps • Weather maps you see on TV include several different lines connecting points of equality. • For example … • Isobars: lines connecting areas of equal air pressure. • Normally drawn at 4 mb. intervals. • Isobars forming closed circles represent areas of high or low pressure. • Isotherms: lines connecting areas of equal temperatures. • Isohypse: lines connecting areas of equal height. • Isohyet: lines connecting areas of equal precipitation.
Barometric Pressure Coding • Most barometric pressure readings fall somewhere between 950 mb. and 1060 mb. Meteorologists use codes to identify pressure levels and the general rules are as follows: • When DECODING: • Add a decimal point between the last 2 digits of the coded 3 digit number. • Add a 9 or a 10 in front of the coded 3 digit number. • If the coded 3 digit number is between 000 and 500 ADD A 10 • If the coded 3 digit number is between 501 and 999 ADD A 9 • When CODING: • Drop the 9 or 10 at the beginning of the full figure. • Drop the decimal point between the last 2 digits.
Barometric Pressure Coding • Decode the following coded barometric pressure readings: • Code the following full figured barometric pressure readings: 782 978.2 mb. 501 950.1 mb. 145 1014.5 mb. 1043.2 mb. 432 977.8 mb. 778 1002.1 mb. 021