Download
1 / 17
170 likes | 264 Views
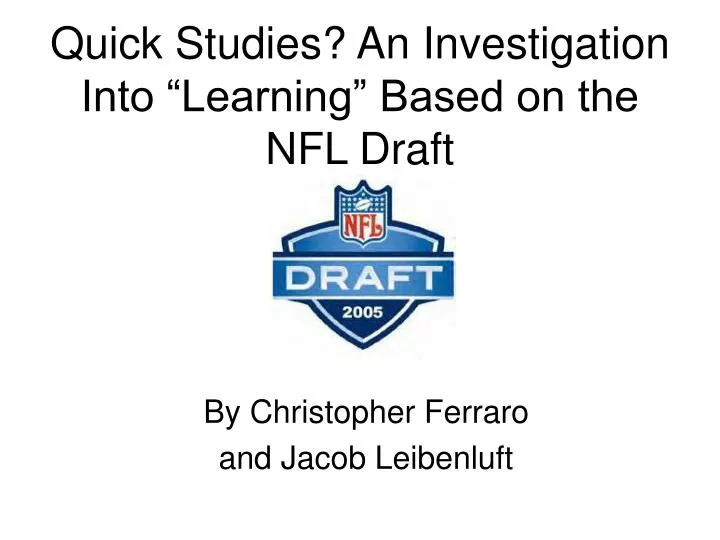
Quick Studies? An Investigation Into “Learning” Based on the NFL Draft. By Christopher Ferraro and Jacob Leibenluft. Introduction. A recent analysis of NFL draft behavior (Massey and Thaler, 2005) finds that teams tend to exhibit “overconfidence” in their ability to assess unproven talent

E N D
Quick Studies? An Investigation Into “Learning” Based on the NFL Draft By Christopher Ferraro and Jacob Leibenluft
Introduction • A recent analysis of NFL draft behavior (Massey and Thaler, 2005) finds that teams tend to exhibit “overconfidence” in their ability to assess unproven talent • In particular, what Massey and Thaler find is that the NFL market tends to “overvalue” high draft picks relative to lower picks or players with known values
Does Learning Happen? • We would expect teams to learn over time and exploit market inefficiencies • Some have: the example of the New England Patriots • Only two top 10 picks in the last 10 drafts • Won three of the past four Super Bowls • Loser’s curse: Bad teams get higher picks, but those picks do not produce as much surplus as lower choices
Experimental Setup • List of players with estimated “PowerPoints” • An “opt-out” value that declines with each successive pick • Group 1: No information given after each round • Group 2: Draft pick’s actual value, plus the names of the top 2 players revealed to each participant
Assumptions • For participants 1-6, the optimal strategy will usually be to pick the player with the highest PowerPoints • For participants 7-9, the optimal strategy will usually be to opt out • Our hypothesis: Over time, participants will recognize their optimal strategy
Assigned Abilities • Players 1-3: PowerPoints distributed around actual value, small spread (sd=5) • Players 4-6: PowerPoints distributed around actual value, large spread (sd=20) • Players 7-9: PowerPoints randomly assigned
Surplus Value – Normal Evaluation Expected Results by Player • We looked at the surplus from each pick — what a participant earned over the comparable opt-out value. • For subjects with PowerPoints distributed around the actual value, we expected to see steady oscillation above zero, meaning these subjects were generally making the correct picks. * Data from Group 1, subject ID 6
Surplus Value – Random Valuation • For a subject with a random distribution (IDs 6-9), we expected to see some early oscillation around zero and then a convergence to zero as they choose to opt out more and more. * Data from Group 2, subject ID 7
Random Subjects Overall Results, Group 1 Normal Subjects
Normal Subjects Random Subjects Overall Results, Group 2
Summary of Opt-Out Strategies Opt-Out Analysis • In general, Group 1 tended to opt out more frequently. • With respect to the top 5 picks, 57 percent of our random subjects in Group 1 chose to opt out relative to 14 percent in Group 2
Gain for Top 5 Picks Surplus from Top Five Picks Note: In this graph, surplus for participants who opted out is calculated as the opt-out value minus what the participant would have earned if he had selected the highest rated player on his sheet
Regression Analysis Learning appears to happen around Round 4 in the second group, but not in the first group - offering weak support for our hypothesis!
Analysis • Why should we be cautious in interpreting these results? • Sample size (number of rounds and number of players) • Some players chose alternate strategies we didn’t expect (Group 2, Player 9) • Questionable design in some cases — three groups instead of two
Applications • The job market • Does a boss rely on his/her own assessment or on proven performance? • How do different employers react to the behavior of other employers? • Auctions for antiques/art • Do buyers learn to follow their own assessments or the “herd”? • “Bargain hunting” vs. masterpieces