Download
1 / 29
290 likes | 373 Views
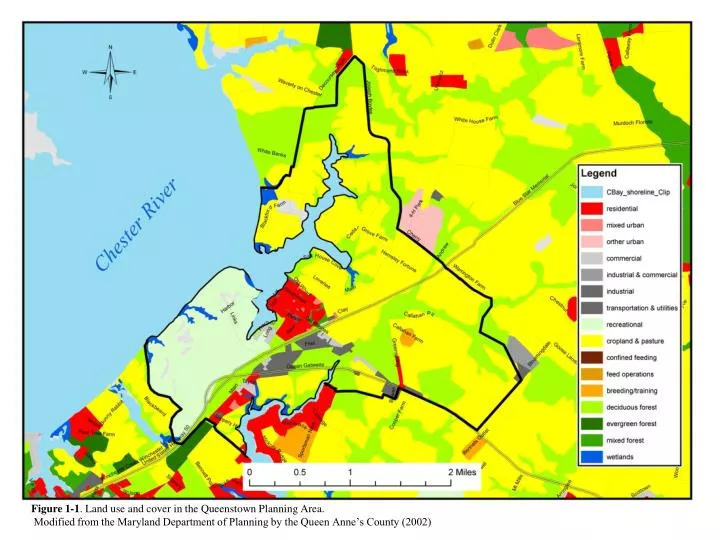
Figure 1-1 . Land use and cover in the Queenstown Planning Area. Modified from the Maryland Department of Planning by the Queen Anne’s County (2002).

E N D
Figure 1-1. Land use and cover in the Queenstown Planning Area. Modified from the Maryland Department of Planning by the Queen Anne’s County (2002)
Figure 1-2. 1998 and 2009 Planning Areas. The 1998 planning area included 2,165 acres. With the Queenstown Creek and Route 18 extensions, the 2009 planning area includes 3,945 acres.
Figure 1-3. Growth potential across the Queenstown Planning Area
Figure 1-5. Build-out of major proposed annexation properties in the Queenstown Planning Area under current County zoning. Additional smaller lots add 40 residential units to the calculated build-out, resulting in a total of 605 units under current County zoning.
Figure 1-6. Planned land use across the Queenstown Planning Area. Sensitive areas include wetlands, 300 foot stream buffers, and Category III hurricane flood zones.
Figure 1-9. Preserved areas in the Queenstown Community Plan. Sensitive areas include 300 foot stream buffers, wetlands, and Category III Hurricane flood zones.
Figure 1-10. Examples of ideal growth strategies for future development in Queenstown.
Figure 1-13. Existing Queenstown production wells, distribution system, and waste water treatment plant (WWTP).
Figure 1-14. Watersheds in the Queenstown Planning Area. Each watershed was divided into hydrologic subunits defined based on topographic flowpath analyses.
Figure 1-15. Land use and land cover currently IMDP 2002) and under alternative future growth scenarios in the Queenstown Planning Area.
Figure 1-16. Annual average total nitrogen loads (pounds per acre per year) estimated with the Maryland Department of Planning’s Nutrient Analysis Spreadsheet.
Figure 1-17. Annual average total phosphorus loads (pounds per acre per year) estimated with the Maryland Department of Planning’s Nutrient Analysis Spreadsheet
Figure 1-18. Flood inundation zones within Queenstown and across the planning area (inset). The dashed box in the inset indicates the extent of the aerial photograph. Sensitive areas identified in the Queenstown Comprehensive Plan include areas prone to flood from a category IIII hurricane (10 to 12 foot storm surge).
Figure 1-19. Timeline of potential build-out and infrastructure improvements in the Queenstown Planning Area. Green numbers indicate a supply surplus, and red numbers indicate a supply deficit.
Figure 2-1. Regional map and physiographic provinces of the East Coast.
Figure 2-3. Map of major Quaternary paleochannel systems of the Susquehanna River beneath the Chesapeake Bay and the Delmarva Peninsula. From Coleman et al. 1990.
Figure 2-4. Silt content and permeability of surface soils in the Queenstown Planning Area. Sand content increases soil permeability and generally decreases with silt content.
Figure 2-5. Geologic cross-section of Maryland Coastal Plain. The geologic stratigraphy controls groundwater supply (yield ) and water quality.
Figure 2-6. Evidence of sea level rise in the Chesapeake Bay. (A) Colonial and (B) modern map of the Chesapeake Bay evidencing the increase in its width and land lost due to sea level rise. (C) Gauge records at Solomons Island, MD, tide gauge, 1937-97. (D) Map of Sharps Island, showing extent of land mass in 1848 ( U.S. Coast Survey, 1848). Inset shows Sharps Island lighthouse, which was built in 1882 (photograph from Vojtech (1997); used with permission from Tidewater Publishers). The former Sharps Island is now submerged, and the lighthouse is surrounded by water three to four meters deeps. All figures are from Larson 1998 (http://pubs.usgs.gov/fs/fs102-98/, accessed 9/9/09).
Figure 2-7. Natural resource areas in the Queenstown Planning Area.
Figure 2-8. Comparison of 100 foot stream buffers (thin black line) and 300 foot stream buffers (thick blue line).
Figure 2-9. Land use and land cover (MDP 2002) within the 300 foot stream buffer across the Queenstown Planning Area.