Download
1 / 28
280 likes | 286 Views
Office hours aplenty. http://users.path.ox.ac.uk/~wjames/Evolution/evolution4_files/slide0006_image035.jpg. Fitness measured over many generations. Fig 25.14. Evolution does not always occur at the same rate. Fig 24.17. Why are intermediate traits sometimes hard to find?.

E N D
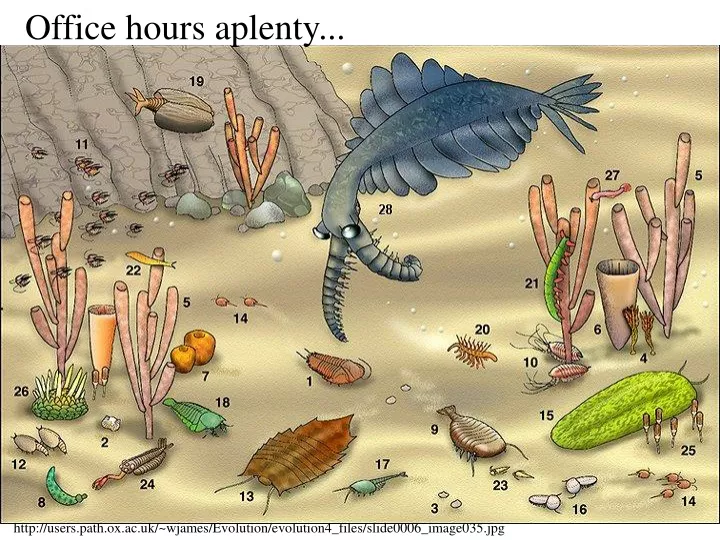
Office hours aplenty... http://users.path.ox.ac.uk/~wjames/Evolution/evolution4_files/slide0006_image035.jpg
Fig 25.14 Evolution does not always occur at the same rate.
Fig24.17 Why are intermediate traits sometimes hard to find?
What drives evolution? What changes selection criteria?
Fig 25.14 The rate of evolution depends on the rate of environmental change.
We do not know what caused the largest extinction event known. Fig 25.14
Fig 25.14 Dinosaur extinction
Fig 25.15 an Asteroid impact, 65 mya
Fig 25.7 History of Earth
Fig 26.21 Life as we know it…
Molecular similarities show relationships that are not obvious by morphology Fig 26.2
Convergent Evolution means that morphology is a poor predictor of evolutionary relationships Fig 26.7
Fig 26.3 phylogenetic hierarchy
Phylogenies as multiple hypotheses Percent difference between sequence Fig 26.14
Fig 26.15 Phylogenies as multiple hypotheses: parsimony
Fig 26.15 Phylogenies as multiple hypotheses: parsimony (more tree making practice in discussion)
Fig 26.21 Life as we know it…
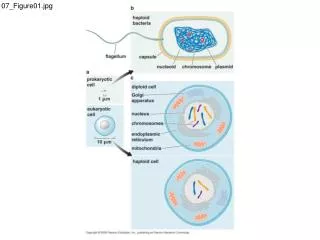
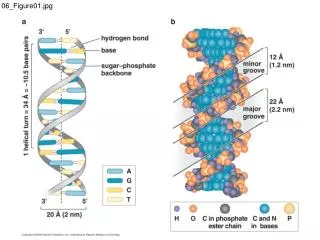
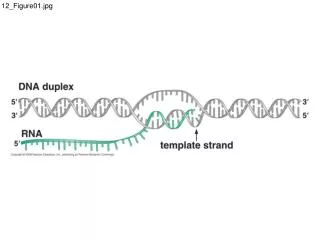
Fig 34.37 DNA is passed from generation to generation, and therefore can tell us about relationships between species.
Only the egg provides mitochondria to the offspring. Fig 47.3 mitochondria
Mitochondrial DNA comparisons can be used to trace ancestry:
Only DNA that is successfully passed on can be used to trace the past. Fig 1
Next: Are we genetically programed to be racist? • Office Hours • Bonuses