Download
1 / 54
540 likes | 555 Views
Hele-Mai Haav: CSC230, Spring’03. Solving Business Problems: Systems Approach. Objectives:. Describe each of the steps of the systems approach to problem solving

E N D
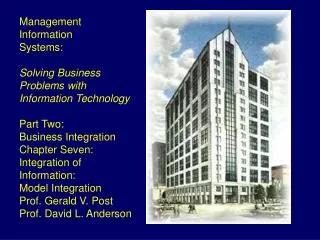
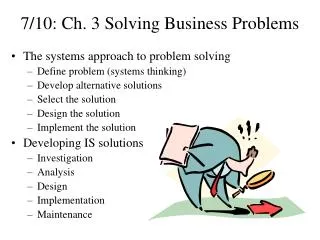
Hele-Mai Haav: CSC230, Spring’03 Solving Business Problems: Systems Approach
Objectives: • Describe each of the steps of the systems approach to problem solving • Use the systems approach, the systems development cycle, and a model of information systems components as problem-solving frameworks to help you to propose IS solutions to simple business problems
FEEDBACK SYSTEM INPUT PROCESS OUTPUT
ENVIRONMENT Customers Suppliers ORGANIZATION INFORMATION SYSTEM INPUT PROCESS OUTPUT FEEDBACK Regulatory Stockholders Competitors Agencies FUNCTIONS OF AN INFORMATION SYSTEM
INFORMATION SYSTEMS INFORMATION SYSTEMS ORGANIZATIONS TECHNOLOGY MANAGEMENT
MIS SOCIOLOGY POLITICAL SCIENCE PSYCHOLOGY APPROACHES TO INFO SYSTEMS TECHNICAL APPROACHES COMPUTER SCIENCE OPERATIONS RESEARCH MANAGEMENT SCIENCE BEHAVIORAL APPROACHES
INTERDEPENDENCE HARDWARE BUSINESS Strategy Rules Procedures SOFTWARE DATABASE TELE-COMMUNICATIONS ORGANIZATION INFORMATION SYSTEM SYSTEM INTERDEPENDENCE
The Systems Approach The systems approach to problem solving uses a systems orientation to define problems and opportunities and develop solutions
Problem-Solving Approach • A methodology is, first and foremost, a problem-solving approach to building systems. • The classical problem-solving approach is as follows: • Study and understand the problem (opportunity, and/or directive) and its system context. • Define the requirements of a suitable solution. • Identify candidate solutions and select the ``best'' solution. • Design and/or implement the solution. • Observe and evaluate the solution's impact, and refine the solution accordingly.
Defining a problem in a systems context • A problem • a basic condition that is causing undesirable results • Symptoms • are signals of an underlying problem Separate symptoms from problems!
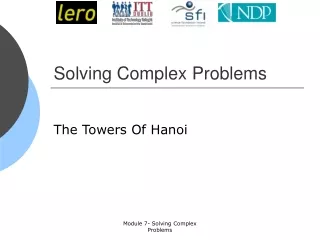
In the business world all you see are symptoms How to see unstructured problems and solve them? Models and systems approach help you.
Systems context The business organization or process in which a problem arises could be viewed as a system of • input, • processing • output • feedback and • control components
Symptom: Sales are declining Problem: Salespersons are loosing orders, because they cannot get info on product prices and availability
Techniques to examine business problems: • Identification business objects, how they are related , and analyzing the data that is needed by end users • Focusing on business processes and activities
Modeling objects:Object-oriented Analysis Account Number Name Client... Open account Close account Savings Account Checking Account
Modeling objects:Event-driven Approach When some business event occurs, an object function is called or property is modified Benefits of OOA: changes are made only to needed classes of objects
Analyzing Systems:Unified Modeling Language (UML) Example: Rolling Thunder Bicycles
UML in One Sentence The UML is a graphical language for • visualizing • specifying • constructing • documenting artifacts of a software-intensive system.
The UML addresses the specification of all important analysis, design, and implementation decisions.
Structural Diagrams Used to visualize, specify, construct, document static aspects of system • class diagram • package diagram [not standard UML] • object diagram • component diagram • deployment diagram
Common Uses of Class Diagrams • to model vocabulary of the system, in terms of which abstractions are part of the system and which fall outside its boundaries • to model simple collaborations (societies of elements that work together to provide cooperative behavior) • to model logical database schema (blueprint for conceptual design of database)
Class • A class is a description of a set of objects that share the same attributes, operations, relationships, and semantics. • An attribute is a named property of a class that describes a range of values that instances of the property may hold. • An operation is a service that can be requested from an object to affect behavior.
Name Attributes Operations Class Notation
Relationships connections between classes • dependency • generalization • association
Dependency A dependency is a “using” relationship within which the change in the specification of one class may affect another class that uses it. Example: one class uses another in operation Window Event handleEvent()
Generalization A generalization is a “kind of” or “is a” relationship between a general thing (superclass or parent) and a more specific thing (subclass or child). Shape Circle Rectangle
Person Company Association An association is a structural relationship within which classes or objects are connected to each other. (An association between objects is called a link.)
Association Adornments • name • role • multiplicity • aggregation • composition
works for Person Company Association Name describes nature of relationship: can also show direction to read name: works for Person Company
Behavioral Diagrams Used to visualize, specify, construct, document dynamic aspects of system • use case diagram • sequence diagram • collaboration diagram • statechart diagram • activity diagram
Use Case and Actor • A use case is a sequence of actions, including variants, that a system performs to yield an observable result of value to an actor. • An actor is a coherent set of roles that human and/or non-human users of use cases play when interacting with those use cases.
Flows of Events • The main flow of events (basic course of action) describes the “sunny-day” scenario. • Each exceptional flow of events (alternate course of action) describes a variant, such as an error condition or an infrequently occurring path.
Use Case Diagram shows primary business processes in organization Simple Use Case Diagram Do Trade Entry Generate Reports Update Portfolio Info
Analyzing Systems:Unified Modeling Language (UML) Example: Rolling Thunder Bicycles worker employee Product Management Assembly Order Entry Purchases Retail store manufacturer Accounting customer
Collaboration Diagram A collaboration diagram is an interaction diagram that emphasizes the organization of the objects that participate in the interaction. A path is a link between objects, perhaps with a stereotype such as «local» attached. Sequence numbers indicate the time ordering of messages, to one or more levels.
Analyzing Systems:Unified Modeling Language (UML) Example: Rolling Thunder Bicycles Class Diagram. It displays the classes, their properties, and the associations or relationships among the classes
Analyzing Systems:STRUCTURED ANALYSIS • DEFINES SYSTEM INPUTS, PROCESSES, OUTPUTS • PARTITIONS SYSTEM INTO SUBSYSTEMS OR MODULES • LOGICAL, GRAPHICAL MODEL OF INFORMATION FLOW • DATA FLOW DIAGRAM:Graphical display of component processes, flow of data
Analyzing Systems:Process Analysis Example: Rolling Thunder Bicycles Process Diagram. It describe how individual processes interact with each other Input Process Output Data flow diagram is a process-oriented technique used for investigating IS. It is designed to show how system is divided into smaller parts and highlight the flow of data between those parts
SYMBOLS FOR DATA FLOW DIAGRAMS (DFD): DATA FLOW Feedback & control PROCESS SOURCE OR SINK FILE
GENERATE BALANCE GENERATE BILL CUSTOMER FILE PAYMENT FILE GENERATE REPORT CUSTOMER MANAGER DATA FLOW DIAGRAM:
STRUCTURED ANALYSIS • DATA DICTIONARY:Controlled definitions of descriptions of all data, such as variable names & types of data • PROCESS SPECIFICATIONS:Describes logic of processes at module level
Developing and evaluating alternative solutions Where do alternative solutions come from? • Experience (previous solutions) • Advice of others • Your intuition and creativity • Simulation of processes (e.g. what-if analysis using Excel; decision support systems ) • “doing nothing” approach
Evaluation of solutions Goal: • to determine how well each alternative solution meets your business and personal requirements • Develop evaluation criteria for evaluation of solutions. • Criteria may be ranked
Selecting the best solution • As alternative solutions have been evaluated using the same criteria, it is possible to compare the solutions and find the best which meets your requirements. • You can have other reasons for not choosing the best one or rejecting all the solutions. • Develop additional solutions.