Download
1 / 40
400 likes | 414 Views
ATM 521 Tropical Meteorology SPRING 2015. ATM 521 Tropical Meteorology SPRING 2015 CLASS# 9825. Instructor: Chris Thorncroft Time: TUES/THURS 11:45-1:05 Room: ES B13 Grading: Graded Phone: 518 442 4555 E-mail: cthorncroft@albany.edu

E N D
ATM 521 Tropical Meteorology SPRING 2015 CLASS# 9825 Instructor: Chris Thorncroft Time: TUES/THURS 11:45-1:05 Room: ES B13 Grading: Graded Phone: 518 442 4555 E-mail: cthorncroft@albany.edu Office Hours: MON 2.00-3.00 or see me or e-mail me for an appointment Aims of Course: To describe and understand the nature of tropical weather systems and their role in the tropical climate, including emphasis on the interactions between dynamics and convection. To highlight unanswered scientific questions and key research areas. Course Assessment: 1. Homework 15% 2. Class exam on Wednesday Mar 10th 25% 3. Class paper due Wednesday May 5th 20% 3. Final exam on Friday May 8th 8.30am-10.30am 40% Text Books: There is no recommended text book for this course.
ATM 521 Tropical Meteorology Sprimg 2015 CLASS# 9825 Relationship to other Graduate Courses dealing with the Tropics: ATM522 Climate Variability and Predictability Interannual-to-Multidecadal ATM523 Large-Scale Dynamics of the Tropics: Synoptic-to-Interannual ATM521 Tropical Meteorology Mesoscale-to-Synoptic (Weather!) ATM527 Observations and Theory of Tropical Cyclones Tropical Cyclones
ATM 521 Tropical Meteorology SPRING 2015 Lecture Plan: 1. Introduction 2. Tropical Convection 3. Large-scale Tropical Circulations 4. Synoptic Weather Systems in the Tropics 5. Tropical Cyclones Dry spells Flooding: Ghana 07 Flooding: New Orleans 05
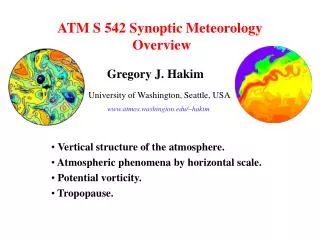
1. INTRODUCTION Where are the tropics and what makes them special? Zonal and time mean circulations Asymmetric circulations
2. TROPICAL CONVECTION Conditional Instability, CAPE, tephigrams Vertical profiles of conserved variables
MESOSCALE CONVECTIVE SYSTEMS Structure, propagation and longevity issues will be discussed as well as their impact on larger scales. See Houze, R. A., Jr., 2004: Mesocale convective systems Rev. Geophys., 42, 10.1029/2004RG000150, 43 pp.
Rainfall Stratiform Rain Fraction Percentage of MCSs with significant ice scattering Average Lightning flash density MESOSCALE CONVECTIVE SYSTEMS TRMM based MCS climatology over Africa and tropical Atlantic for June-July-August Schumacher and Houze (2006) QJRMS : Less stratiform rain over sub-Saharan Africa than Atlantic but, Stratiform rain increases in monsoon season compared to pre-monsoon season due to (i) reduced upper-level shear?, (ii) reduced impact of dry SAL?, (iii) other?
Heat Low SAL AEJ ITCZ 3 LARGE-SCALE TROPICAL CIRCULATIONS Key features of the West African Monsoon Climate System during Boreal summer Cold Tongue Observations and theory of monsoons Theories for large-scale motion Emphasis given to West African Monsoon
4. SYNOPTIC WEATHER SYSTEMS IN THE TROPICS Emphasis given to: Easterly Waves Convectively Coupled Kelvin Waves
4. SYNOPTIC WEATHER SYSTEMS IN THE TROPICS Easterly waves are the dominant synoptic weather system in the Africa-Atlantic sector but they also exist in other basins (e.g. Pacific) We will discuss their structure and theories for their existence and growth including how they interact with MCSs. We will also discuss their variability.
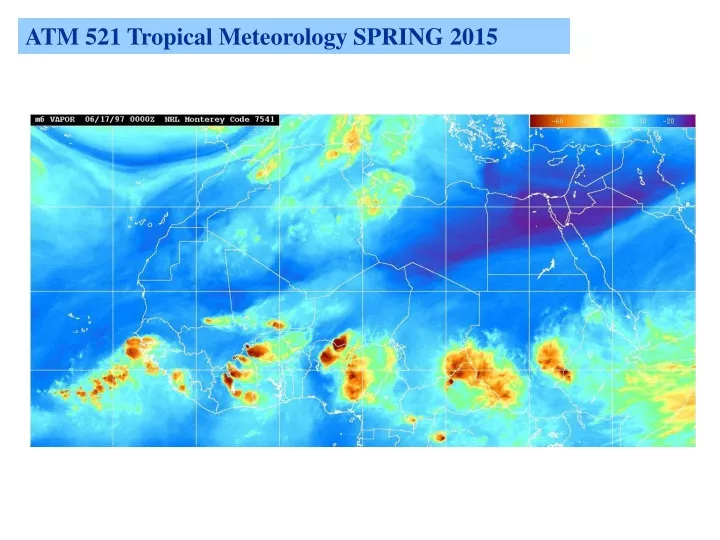
Diagnostics for highlighting multi-scale aspects of AEWs 315K Potential Vorticity (Coloured contours every 0.1PVU greater than 0.1 PVU) with 700hPa trough lines and easterly jet axes from the GFS analysis (1 degree resolution), overlaid on METEOSAT-7 IR imagery.
315K Potential Vorticity (Coloured contours every 0.1PVU greater than 0.1 PVU) with 700hPa trough lines and easterly jet axes from the GFS analysis (1 degree resolution), overlaid on METEOSAT-7 IR imagery.
315K Potential Vorticity (Coloured contours every 0.1PVU greater than 0.1 PVU) with 700hPa trough lines and easterly jet axes from the GFS analysis (1 degree resolution), overlaid on METEOSAT-7 IR imagery.
315K Potential Vorticity (Coloured contours every 0.1PVU greater than 0.1 PVU) with 700hPa trough lines and easterly jet axes from the GFS analysis (1 degree resolution), overlaid on METEOSAT-7 IR imagery.
315K Potential Vorticity (Coloured contours every 0.1PVU greater than 0.1 PVU) with 700hPa trough lines and easterly jet axes from the GFS analysis (1 degree resolution), overlaid on METEOSAT-7 IR imagery.
315K Potential Vorticity (Coloured contours every 0.1PVU greater than 0.1 PVU) with 700hPa trough lines and easterly jet axes from the GFS analysis (1 degree resolution), overlaid on METEOSAT-7 IR imagery.
315K Potential Vorticity (Coloured contours every 0.1PVU greater than 0.1 PVU) with 700hPa trough lines and easterly jet axes from the GFS analysis (1 degree resolution), overlaid on METEOSAT-7 IR imagery.
315K Potential Vorticity (Coloured contours every 0.1PVU greater than 0.1 PVU) with 700hPa trough lines and easterly jet axes from the GFS analysis (1 degree resolution), overlaid on METEOSAT-7 IR imagery.
315K Potential Vorticity (Coloured contours every 0.1PVU greater than 0.1 PVU) with 700hPa trough lines and easterly jet axes from the GFS analysis (1 degree resolution), overlaid on METEOSAT-7 IR imagery.
315K Potential Vorticity (Coloured contours every 0.1PVU greater than 0.1 PVU) with 700hPa trough lines and easterly jet axes from the GFS analysis (1 degree resolution), overlaid on METEOSAT-7 IR imagery.
315K Potential Vorticity (Coloured contours every 0.1PVU greater than 0.1 PVU) with 700hPa trough lines and easterly jet axes from the GFS analysis (1 degree resolution), overlaid on METEOSAT-7 IR imagery.
315K Potential Vorticity (Coloured contours every 0.1PVU greater than 0.1 PVU) with 700hPa trough lines and easterly jet axes from the GFS analysis (1 degree resolution), overlaid on METEOSAT-7 IR imagery.
315K Potential Vorticity (Coloured contours every 0.1PVU greater than 0.1 PVU) with 700hPa trough lines and easterly jet axes from the GFS analysis (1 degree resolution), overlaid on METEOSAT-7 IR imagery.
315K Potential Vorticity (Coloured contours every 0.1PVU greater than 0.1 PVU) with 700hPa trough lines and easterly jet axes from the GFS analysis (1 degree resolution), overlaid on METEOSAT-7 IR imagery.
315K Potential Vorticity (Coloured contours every 0.1PVU greater than 0.1 PVU) with 700hPa trough lines and easterly jet axes from the GFS analysis (1 degree resolution), overlaid on METEOSAT-7 IR imagery.
315K Potential Vorticity (Coloured contours every 0.1PVU greater than 0.1 PVU) with 700hPa trough lines and easterly jet axes from the GFS analysis (1 degree resolution), overlaid on METEOSAT-7 IR imagery.
315K Potential Vorticity (Coloured contours every 0.1PVU greater than 0.1 PVU) with 700hPa trough lines and easterly jet axes from the GFS analysis (1 degree resolution), overlaid on METEOSAT-7 IR imagery.
4. SYNOPTIC WEATHER SYSTEMS IN THE TROPICS Different Approaches to Develop Understanding: Observations Theory Modeling (Modeling, NWP, Climate Modeling, Cloud-Resolving)
4. SYNOPTIC WEATHER SYSTEMS IN THE TROPICS L H H L cat3 convergence convection Solution of the shallow water model Kelvin waves are the dominant synoptic weather system in the equatorial Africa sector in Spring but they also exist in other basins (e.g. Pacific, Amazon) and seasons. We will discuss their structure and theories for their existence and growth including how they interact with MCSs and EWs.
L H Evolution of Kelvin waveNegative phase • OLR (W/m2) • Shading: min convection • max convection • Wind at 850 hPa (m/s) • Vectors, significant at the T-test 99% level • Surface Pressure (Pa) • Contours dashed: low L • continue: high H
H L Evolution of Kelvin waveInitiation phase • OLR (W/m2) • Shading: min convection • max convection • Wind at 850 hPa (m/s) • Vectors, significant at the T-test 99% level • Surface Pressure (Pa) • Contours dashed: low L • continue: high H
L H Evolution of Kelvin waveActive phase • OLR (W/m2) • Shading: min convection • max convection • Wind at 850 hPa (m/s) • Vectors, significant at the T-test 99% level • Surface Pressure (Pa) • Contours dashed: low L • continue: high H
H Evolution of Kelvin wave Dissipation phase • OLR (W/m2) • Shading: min convection • max convection • Wind at 850 hPa (m/s) • Vectors, significant at the T-test 99% level • Surface Pressure (Pa) • Contours dashed: low L • continue: high H
MCSs embedded in Kelvin wave envelops Brightness Temperature (K) Resolution spatial : 0.5° temporal : 3 hours
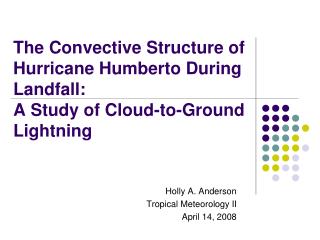
5. TROPICAL CYCLONES Observations and theory of tropical cyclones including issues that relate to genesis, structure and track.
5. TROPICAL CYCLONES Synoptic weather systems can influence tropical cyclogenesis – the role of Easterly waves and Kelvin waves will be discussed SAL AEWs TC MCSs
5. TROPICAL CYCLONES: FIELD CAMPAIGNS See: http://www.espo.nasa.gov/hs3/
FINAL OVERVIEW COMMENTS The course is fundamentally about the interactions between dynamics and convection, combining observations, modeling and theory. Ultimately a major motivation for research in this area is to improve our ability to predict tropical convection (over a range of space and timescales). This remains a major challenge and MUCH remains to be learned. While the emphasis here is given to weather systems, a worthy study in its own right, one should always recall that climate is the sum of the weather systems and that models used to predict climate must be able to represent the impacts of weather. ANY REQUESTS?