Download
1 / 17
170 likes | 352 Views
Using WITI for Airport Arrival Performance Analysis A report on work-in-progress December 2010. WITI and WITI-FA (“Forecast Accuracy”). WITI = “Weather weighted by traffic” En-route weather E-WITI uses actual convective Wx data, e.g. NCWD

E N D
Using WITI for Airport Arrival Performance AnalysisA report on work-in-progressDecember 2010
WITI and WITI-FA (“Forecast Accuracy”) WITI = “Weather weighted by traffic” • En-route weather • E-WITI uses actual convective Wx data, e.g. NCWD • E-WITI-FA uses convective forecast data, e.g. CCFP, LAMP, … • Both use the same scheduled traffic on major flows • Convective forecast data is converted to “quasi-NCWD” format • Terminal weather • T-WITI uses actual surface Wx data (METARs) • T-WITI-FA uses surface Wxforecast data (TAFs) • Both use the same scheduled traffic at major airports • TAF converted to quasi-METAR form, “rolling look-ahead” stream
Framework for Quantifying Avoidable and Unavoidable Weather Impact Weather Event VFR VFR Airport Capacity Rate Arrival Rates IFR Actual Arrivals region of possible avoidable costs Time
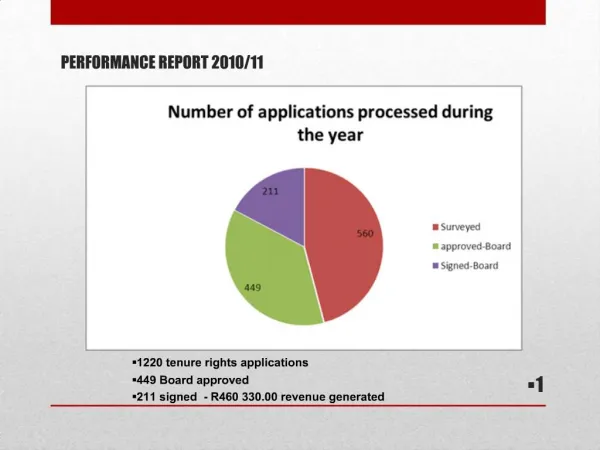
Arrival Rate Deficit: Illustration Example: LGA, 04/03/2009 Forecast called for rain, low ceilings and strong winds from the southwest which would have forced LGA into a single-runway operation with low arrival rate. Actual winds were much weaker. Ceilings lifted earlier than forecast. Deficit between scheduled and actually-achieved arrival rates needs to be measured Portion attributable to inaccurate weather forecast needs to be quantified This portion then needs to be split into two pieces: see next slide
Avoidable and Unavoidable Portions of Arrival Rate Deficit: Breakdown Bad Weather Unavoidable Reasonable risk mgmt Deficit Impact caused by other airports Accidents, outages, VIP flights, security, etc Inaccurate forecast Avoidable Overly conservative TMI Actual AAR < TMI (in excess of risk mgmt) En-route to Terminal to Final Transition Unavoidable portion of arrival rate deficit (gap between “scheduled” and “maximum-achievable-given-actual-Wx” arrival rates) needs to be subtracted from overall deficit. A reasonable risk mitigation factor (% arrival rate?) should also be subtracted. Impact caused by other airports, unrelated to this one, should be subtracted as well. What’s left is the avoidable portion. It can be subdivided into 4 categories: (a) Deficit caused by inaccurate forecast; (b) Overly conservative TMI – related to (a) and possibly partly caused by it; (c) Actual AAR below TMI’s (even after discounting for risk factor), and (d) Transition.
Adding GDP InformationGDP and non-GDP Periods Non-GDP Non-GDP GDP GDP
Non-GDP Arrival Rate Deficit Dissection • Over-forecast and actual arr rate < scheduled: • all the deficit goes toward avoidable delay (“Non-GDP Inefficiencies”); • a portion of the deficit is attributed to Wx forecast inaccuracy Avoidable delay = 0 (actual arr rate >= scheduled) Not counted (scheduled arrival rate is too low)
GDP Arrival Rate Dissection GDP Setup Inefficiency (but avoidable delay due to GDP Wx forecast inaccuracy = 0) No impact (GDP > scheduled rate) GDP Execution Inefficiencies
Avoidable Delay/Cost analysis work is in progress and will continue in FY11Another WITI application: airport delay prediction(Both programs are funded by the FAA ATO-P Aviation Weather Group and led by AvMet Applications, Inc)
Training WITI Model on Airport Delay Example: ATL, 2007 (WITI based on actual Wx) Once trained on historical data, the Airport WITI model can be used for delay prediction using forecast Wx and scheduled traffic for the day
Hourly Delay Forecast, 06/08/2008 Forecast: LAMP (convective); TAF (surface)
WITI: Measuring Weather / Traffic Impact “The Hand the NAS Is Dealt Every Day” The Weather Index (WITI) expresses severity of weather impact on the NAS, weighted by air transportation service demands En-route Convective Weather Local Airport Weather Capacity, Safety constraints Traffic Demand ATM, Airline Response Strategies Operational Outcomes National Airspace System (NAS)
WITI CompositionWeather Weighted by Traffic, Quantified WITI is a weighted sum of three components: • En-route Component: hourly frequency on major flows X amount of convective Wx that these flows cross • Terminal Component • Linear part:capacity degradation due to terminal weather impact, proportional to number of ops • Non-linear (Queuing Delay) partreflecting excess traffic demand vs. capacity • Used by the FAA and NWS on a regular basis: • Measure system performance in an objective manner – weekly reports • Compare different seasons’ Wx/traffic impact with outcomes (e.g. delays) 15
Method: Use Airport Arrival RatesCompute Arrival Rate Deficit • We compare: • Scheduled arrival rates from ASPM database • Actual arrival rates, also from ASPM • Model-generated arrival capacity based on METARs (i.e., actual weather data) • Model-generated rates capacity based on TAFs (i.e., forecast weather data) • Computed using a parametric model of airport capacity under different Wx conditions • Use FAA’s airport capacity benchmarks and historical data on actual airport throughput • Any arrival rate deficit (“possible minus actual”) may be an indication of avoidable delays / cancellations
Re-Tooling WITI as an Airport Model Standard WITI is a NAS Wx Impact assessment tool A weighted sum of 3 components • Weights computed to provide best correlation between WITI and Delay for OEP34 airports combined WITI can be re-tooled as an airport model / delay predictor • Use an airport specific, much more detailed WITI metric and “train” it on that airport’s delay-vs-Wx-and-traffic-demand data • 12 components instead of 3 (“ATL Wind WITI, EWR Snow WITI, ORD Convective WITI”, etc) Calibrate WITI straight to minutes-of-delay for direct comparison with actual ASPM delays