Download
1 / 17
170 likes | 274 Views
Using biomonitoring data to assess possible causes of biological impairment: predictive models. D.M. Carlisle, USGS NAWQA, Reston, VA C.P. Hawkins, Western Center of Biological Assessment, Utah State University, Logan, UT. The Challenge. Bioassessment → impaired condition

E N D
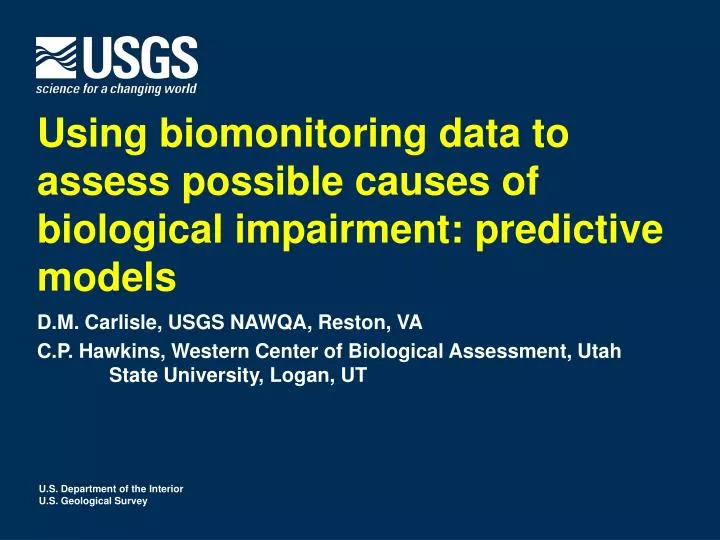
Using biomonitoring data to assess possible causes of biological impairment: predictive models D.M. Carlisle, USGS NAWQA, Reston, VA C.P. Hawkins, Western Center of Biological Assessment, Utah State University, Logan, UT
The Challenge • Bioassessment → impaired condition • Causes of impairment (physical, chemical, biological) difficult to infer • Multiple stressors • Lack of data • Need to infer proximal causes → TMDL
A Tool from Ecological Theory? • Species have inherent traits for survival • optima for natural conditions • tolerances to contaminants • habitat preferences • life-history characteristics • Species with some traits selectively removed by anthropogenic environmental changes– stressor ID?
Using Traits for Stressor Identification • Known traits • Stressor specificity • Site-specific assessment • Are the traits observed at a site different than what would be expected in the absence of anthropogenic disturbance?
Known “Species” Traits • Database of aquatic North American invertebrate traits: www.usgs.gov/nawqa/ecology/(Vieira et al. 2006) • Life history, current preference, habitat preference • Genus tolerance values for 5 physical-chemical stressors • ~1100 NAWQA sites nation wide • Ranked (1-10) weighted averages
Traits Indicative of Specific Stressors • Nutrients--- Nutrient or DO tolerance value • Flow Reduction--- Current Preference Trait
Assessment of Traits:Do traits at a site differ from natural condition? Predictive models (RIVPACS, Wright et al. 1984) • Generates site-specific estimates of probabilities of occurrence for taxa under natural conditions • If we can predict taxon occurrence (E), THEN we can predict trait occurrence because taxa “carry” the traits
Example: O/E for Traits TaxonPc Baetis 0.8 Epeorus 0.9 Sialis 0.7 Taxon Fast Slow Tolerance Baetis 1 0 6 Epeorus 1 0 4 Sialis 0 1 9 Taxon Fast Slow Tolerance Baetis 0.8 0 4.8 Epeorus 0.9 0 3.6 Sialis 0 0.7 6.3 E 1.7 0.7 6.1 Observed: O 1 1 9 O/E 0.6 1.4 1.5
Thresholds for Traits Assessment 10% 90% Mean=1.0 SD=0.26 0 1 2 O/E--Fast current preference
An Example Application • Predictive model for invertebrates • 310 reference-quality sites: calibration • 30 reference-quality sites: model validation • 30 sites in New England along gradient of urbanization • State and local assessments of impairment (11) and stressor ID
Road density 2 km/km2
Road density 6 km/km2
Site Impairment: Oxygen & flow 2.0 Oxygen Oxygen & ↓ Flow 1.5 O/E DO 1.0 Fully supporting Non-supporting 0.5 ↓ Flow 0.0 0.0 0.5 1.0 1.5 2.0 O/E Fast current
Conclusions • Species traits = theoretical basis, sensitive to environmental changes, may facilitate stressor diagnosis • Predictive models can be extended for use in diagnostic efforts • National / regional tool with local relevance
Acknowledgements • NAWQA field personnel • Nicole Vieira & LeRoy Poff, CSU • Michael Meador & Stephen Moulton, USGS • Ellen Tarquinio, USEPA
Tolerance Values & Urban Land Cover nutrients ions DO/temp 2.0 1.5 O/E 1.0 0.5 0.0 8 2 4 6 8 2 4 6 8 2 4 6 Road Density (km/km2)