Download

1 / 21
210 likes | 435 Views
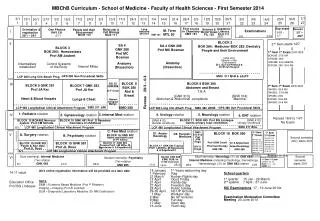
School of Public Health, Faculty of Medicine A/Prof Deborah Schofield. Associate Professor Deborah Schofield. (NRUDRH, Faculty of Medicine, University of Sydney, Lismore 02 6620 2601; dschofield@med.usyd.edu.au) Ageing and the Intergenerational Reports: A policy perspective

E N D
School of Public Health, Faculty of MedicineA/Prof Deborah Schofield
Associate Professor Deborah Schofield (NRUDRH, Faculty of Medicine, University of Sydney, Lismore 02 6620 2601; dschofield@med.usyd.edu.au) Ageing and the Intergenerational Reports: A policy perspective Australian Centre for Economic Research on Health (ACERH), Customs House, Brisbane, 22 February 2008
What are the IGRs? The Intergenerational Report is required, by the Charter of Budget Honesty, every five years. CHARTER OF BUDGET HONESTY ACT 1998 SECT 21 Contents of intergenerational report An intergenerational report is to assess the long term sustainability of current Government policies over the 40 years following the release of the report, including by taking account of the financial implications of demographic change.
What are the IGRs? cont How the Treasurer described it: • “It is to report honestly and openly on the effect this generation will have for the one that follows. … It would be unfair if we indulged a standard of living today at the expense of the standards of living for our children and their children.” • The IGR has been enormously influential in setting government policy. “In practically every portfolio area – health, education, family benefits, welfare, superannuation, pensions – the IGR now provides the overall architecture within which we operate”. http://www.treasurer.gov.au/tsr/content/speeches/2007/003.asp
Budget balance “After taking into account the strong fiscal starting position of a surplus of just over 1 per cent of GDP, demographic trends mean that government spending is projected to exceed revenue by around 3½ per cent of GDP by 2046-47. This is a significant improvement.”
Why has projected budget balance improved? Summary: • Lower rate of spending per person (lower unemployment) • Higher projected GDP per person (higher skilled migration) • Changed methods – particularly health
Slide 8: Projections of Australian Government spending by category
Table 3.1: Real growth rates for Australian Government health spending (per cent)
Comparison Other than PBS (growth higher but methods produce lower spending as % of GDP) and “other” the underlying growth rates are hard to compare But we can compare some projected and actual spending from BP2 and methods
Spending on the MBS Projected for 04/05 In 3 years under estimated by 7%. Why? New measures – bulk billing incentives Budget papers no. 2
Spending on the PBS Projected for 04/05 In 3 years under estimated by about 15%. Why? Delay in introducing measures index, trend assumed same level of other savings as history every year (in addition to the 2002 budget measures) Budget papers no. 2
So how did this happen? PBS Growth by age not yet able to be captured (data series not long enough) Lowering factors: Higher GDP, exponential growth constrained by nearly half in out years Increasing factors: Higher overall growth rate, higher in base year • Results lower than IGR1
Other private health insurance subsidies modelled separately • Results higher than IGR1
Health in summary If the methods had been the same as IGR1 spending on health as a % of GDP (even with GDP growth) probably would not have fallen and may well have been higher due to higher PBS growth rate, greater MBS spending and the plan to model private health insurance subsidies separately when data became available
Some possible speed bumps • Political awareness of influence of the aged as a potential deciding demographic – eg. 40% private health insurance rebate • Life expectancy – obesity, diabetes • Productivity: has been lower than assumed and drawing new labour may be from less productive sources pp xi, 40
Some possible speed bumps cont • Pharmaceutical spending – some changes don’t constrain growth (but generics, high cost drug cost sharing etc may) • PBS growth amongst older ages Labour costs in health offset by shortages – MBS, hospitals • Labour force participation of professions who typically work beyond 60 years eg medical practitioners, dentists