Download
1 / 15
170 likes | 399 Views
Multivariate Data/Statistical Analysis. SC504/HS927 Spring Term 2008. Week 18: Relationships between variables: simple ordinary least squares (OLS) regression. Outline. What is regression analysis? Scatter plots Linear regression Terminology and notation Interpreting a regression equation

E N D
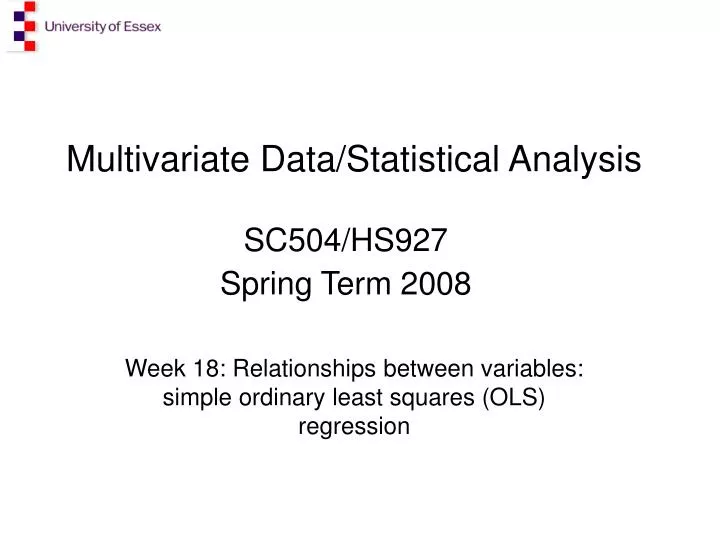
Multivariate Data/Statistical Analysis SC504/HS927 Spring Term 2008 Week 18: Relationships between variables: simple ordinary least squares (OLS) regression
Outline • What is regression analysis? • Scatter plots • Linear regression • Terminology and notation • Interpreting a regression equation • Putting it into practice
What is regression analysis? A statistical technique for: • analysing the association between variables (e.g. how is alcohol consumption related to income on average ?) • making conditional predictions (e.g. what do we expect to happen to smoking behaviour if tobacco taxes increase?) • testing hypotheses about the nature of conditional relationships (e.g. on average do crime rates vary in proportion to unemployment rates?) • summarizing/describing data on 2+ variables
How do we summarise the relationship between suicide and unemployment rates? • Assume a straight-line (linear) relationship between suicide rate (y) and unemployment rate (x): y=a + bx • Estimate a and b by applying ordinary least squares regression to the data in the scatter plot: estimate of a = 1.435 estimate of b = 0.324
Method of Least Squares • A method of finding the line that best fits the data • The line of ‘best fit’ is found by ascertaining which line, of all possible lines, results in the least amount of difference between observed data points and the line
Interpretation y=1.435 + 0.324x • if unemployment (x) is zero, suicide rates are predicted to be 1.435 per 100,000 population • each 1 percentage point increase in unemployment increases the predicted suicide rate by 0.324 • relationship between y and x is not exact so we usually write: y=a + bx + e
Terminology and notation yi=a + bxi + e • xi and yi are variables which have different values for each individual/ observation • they vary across cases in dataset (i refers to case (individual) i) • y=dependent variable • x=independent variable • a and b are unknown (not observed) constants • a and b are population parameters • a and b are to be estimated from sample data • e is error/disturbance/residual term
a is the y-axis intercept y a 0 x
b is the slope or coefficient of x y b 1 a 0 x
A note on causality • Just because we write: yi=a + bxi + e • Does not mean x causes y • Suppose y = income, x = whether or not someone is an owner-occupier • would turning renters into homeowners increase their incomes? • or is it that you need a good income to be able to purchase a home? • or that people on low incomes are more likely to be eligible for social rented housing
What is the relationship between suicide and unemployment? • Which is your ‘dependent’ variable? • Use Graphs – scatter- simple- define-OK • Double click on chart. Go to: Elements-Fit line at Total. You can also change axes by going to: Edit- Select Y [X] axis • For the values, use Analyse – regression - linear
SPSS Output R = .702 (simple correlation between suicide and unemployment) R² = .493 (unemployment rates can account for 49% of the variation in suicide rates)
a = intercept (constant) = 1.435 b = gradient (unemployment rate per 100) = .324 In 1997, the unemployment rate was 1 (per 100) therefore…… Suicide rate = 1.435 + .324 x 1 = 1.759 (per 100000)