Download
1 / 44
460 likes | 725 Views
The MOS Development Process. Dave Saylor Ann Arbor, MI 12-5-2011. Agenda. What is our process for achieving the AOP in 2012? What is it called? Review the process Review the 2012 Top Level Matrix Deploy to your areas How do we manage the process ? What are the expectations for me?.

E N D
The MOS Development Process Dave Saylor Ann Arbor, MI 12-5-2011
Agenda • What is our process for achieving the AOP in 2012? • What is it called? • Review the process • Review the 2012 Top Level Matrix • Deploy to your areas • How do we manage the process ? • What are the expectations for me?
Hoshin Kanri • Professor Kaoru Ishikawa, late 1950s • Benchmarked MBO planning but saw limitations • Infrequent reviews • Not necessarily tied to organizational goals • Largely ignores input lower organization levels • Missed coaching opportunities • Developed HoshinKanri process to foster better organizational planning and execution of key initiatives • Hoshin (shiny metal, compass, pointing the direction) + Kanri (management or control) =HoshinKanri(management compass)
Intentions of Hoshin Kanri • Focus on a shared goal • Communicate that goal to all leaders • Involve all leaders in planning to achieve the goal • Hold participants accountable for achieving their part of the plan Assumes daily controls and performance measures are in place
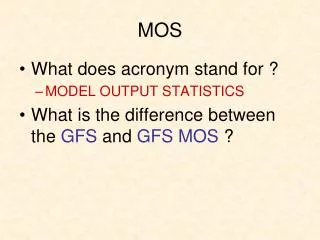
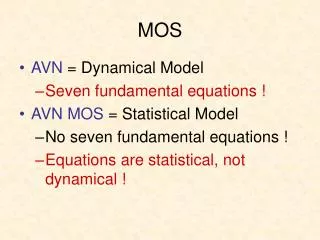
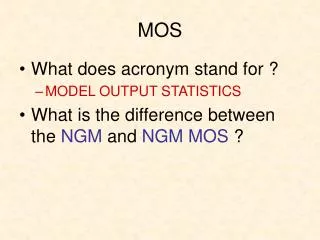
What do we call the process? • Policy Deployment • Strategy Deployment • Goal Deployment • McMOS • MOS = Masco Operating System
MOS Planning Matrix Elements How Who How much What
Primary vs. Secondary Responsibilities • Solid dot responsibilities: • Manage the Action Plan • Create Countermeasures as necessary • Provide monthly updates • Secondary dot responsibilities • Update their portion of the Action Plan • Support construction of Countermeasures • Support monthly updates
Cascading vs. Action Plan Assignments • “C” means Action Plan responsibility is cascaded down • Action Plan management • Countermeasures management • “AP” means the Action Plan is created at this level
Transfer Targets from the X Matrix to the Bowling Chart Targets
Bowling Charts • A Bowling Chart supports every matrix • Targets from the matrix flow into the Bowling Chart • Targets are reviewed after each period
Objectives vs. Key Process Indicators (KPIs) • MOS is a process for managing the high priority objectives • Critical to 2012 success • Provides focused management on the critical few • KPIs are managed separately • Not designed for complete individual performance management • Self-improvement objectives • Leadership traits • Legal/Safety compliance • Maintenance of existing standards
Driving Business Improvement Innovation Breakthrough Objectives Kaizen Level in Organization KPIs Maintenance of Standard Methods Focus/Time
How can we track MOS objectives and KPIs? AOP KPI Scorecard MOS Bowling Chart
Managing KPIs and MOS Objectives • One workbook with separate tabs • Bowling Chart with Targets to Improve • Key Process Indicators (KPIs) • Do I review each of these in the same meeting? KPI Scorecard MOS Bowling Chart
Cascading Process • Top Level Objectives flow into the 2nd Level Matrix (rotate 90 degrees from the “North” quadrant to the “West” quadrant) • 2nd Level Improvement priorities can be cascaded down to the next level • Cascade down to the appropriate “point of impact” for your business
Cascading Annual Objectives Top Level Priorities Top Level Priorities Strategic $ Goals Top Level Matrix Second Level Matrix 2012 Objectives 2012 Objectives 2nd Level Priorities Targets Targets
The same method is used for subsequent levels 2nd Level Priorities Top Level Priorities Top Level Priorities 2nd Level Priorities Second Level Matrix Third Level Matrix 2012 Objectives 3rd Level Priorities Cascade to the “point of impact” Targets Targets
Targets transfer to the MOS Bowling Chart Second Level Targets
Action Plans • After the planning matrix is completed, Action Plans are created at the appropriate level • The Action Plan is a project management tool • Specifies key activities • Designates responsibilities • Defines due dates • Action Plans are “vetted” with the next level up • Ensures proper resourcing • Aligns expectations
Catchball • Catchball is the two-way planning process for reaching agreement & deployment of objectives to subsequent levels • Delegating the “How” doesn’t mean “do it your way” • Plans must be vetted& approved • Key questions for managers: • Are these the right actions to achieve the objective? • Are the actions resourced properly? • Is the plan aggressive enough?
Countermeasures are used for course corrections • Actual performance is compared to Planned Targets each period • Red indicates the plan was not achieved • Every red area requires a Countermeasure • The Countermeasure is a corrective action plan that aims to restore performance to plan by the next reporting period
Sample Countermeasure #1 Define the problem and describe it with data. Where/when does the problem occur? Where/when does it not occur? • Problem Description (What, Where, When) • Observed Inventory Turns trending below plan. • Observed WIP higher than planned levels in Machine Cell 1. • Purchased castings are below plan but still relatively high. • Root Cause Analysis (Why) • Poor inventory turns resulted from high WIP levels in Machine Cell 1. WIP levels calculated based on internal lead times. The primary driver of lead time is setup time. • CountermeasuresWhoWhen • Perform setup reduction in Machine Cell 1 Wilcox 12/15/2011 • Recalculate WIP inventory kanban levels Gibson 11/20/2011 • Investigate foundry stocking of castings Sparky 12/3/2011 • Begin stocking program with 1st foundry HoJo 12/20/2011 Does the logic follow from the Problem Description ? Has the team used a Fish Bone Diagram or 5-Why Analysis to uncover the true Root Cause? Watch for “I think, I feel . . “ statements. Are we attacking the Root Cause? Will these actions get us back on plan next period? Will additional resources allow us to be more aggressive?
Sample Countermeasure #2 • Problem Description (What, Where, When) • Grossscrap costs for September are above the target. • Root Cause Analysis (Why) • This is a busy time of year and standards have slipped. • CountermeasuresWhoWhen • Reinstruct operators on importance of doing a good job Mgt on-going • Setup disciplinary action for poor quality Mgt on-going • Clean up careless mistakes Suh on-going
Sample Countermeasure #3 • Problem Description (What, Where, When) • OTC 99.53% vs. 99.6% goal resulting in high backorders. The • first week of the period accounted for 42% of the total backorders. • The first week was the recovery period caused by the poor year- • end customer service. Of the 77 backorders, 66 resulted from the • following categories: • “Glass" (28), • "not reported" (20), • "external parts" (13) & • "late to distribution" (5). • Root Cause Analysis (Why) • The major contributor of backorders under the "Glass" category was controlled number glass (accounting for 23 of the 28 misses). Glass was not usable due to breakage (15) and defects (8). Poor communication process resulted in the high number listed under the "Not Reported" category. • CountermeasuresWhoWhen • Establish kaizen team to attack breakages Stafford 1/15/2012 • Require supplier to complete CAR for defects Johnson 1/20/2012 • Document data collection process & train team Schwartz 1/3/2012
Sample Countermeasure #4 • Problem Description (What, Where, When) • Project to reduce customer call waiting times is behind schedule. • Root Cause Analysis (Why) • Project team members were busy training new employees. Meetings had to be cancelled due to work load. • CountermeasuresWhoWhen • Reschedule meetings Sam 12/11 • Make attendance a priority All on-going • Notify management when conflicts arise All as required
Estimating Project Completion with a Work Breakdown Structure (WBS)
Sample Countermeasure #5 • Problem Description (What, Where, When) • ReducingCustomer Call Waiting Time project is at • 45% completion through April vs. 64% goal. A key • training milestone is behind schedule as described below. • Root Cause Analysis (Why) • Four key milestones were due in April. Three of the four were completed but not the training of the Customer Care Representatives (CCRs). After receiving student input from the first pilot training session, materials were revised to make the training more effective. This caused a delay in the roll-out schedule. Of the 30 CCRs, 22 were trained through the end of the month. The 8 CCRs are all located at the Syracuse Service Center. Travel to the location by Alan was rescheduled to May. • CountermeasuresWhoWhen • Add an additional training session in May Milt 5/05/12 • Reassign Cathy’s May assignments to Gibby Don 5/10/12 • Schedule team meeting to assess future training Don 5/23/12 • Review Action Plan and ensure training revision time Linda 5/28/12is planned in the project schedule
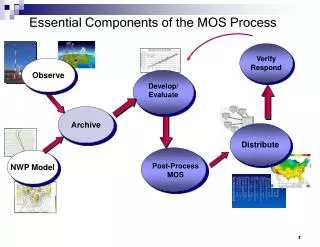
MOS follows the PDCA cycle Do (Action Plan) Plan (MOS Matrix) Act (Countermeasure) Check (Bowling Chart)
Elements of the MOS meeting • Set the appropriate tone • Insist on proper preparation • Focus on Bowling Chart red targets and unfavorable trends • Review Countermeasures • Are these the right actions? • Do the actions have specific owners and dates for completion? • Are the actions aggressive enough? • Does the team have the appropriate resources? • Review & establish expectations for the next meeting
MOS Meeting . . . Best Practices • Keep a running Leader’s notebook • Capture key assignments • Follow up during the month • Review your team’s process for managing Action Plans • Are they meeting regularly? • Are they achieving the milestones? • Countermeasures • Not just for actual missed targets • Look for negative trends • Summarize the meeting before commencement • Leader summarizes Bowling Chart • Review assignments made during the review
Review 2nd Level Matrices • HR • Chuck Loudermilk, Karen Strauss • Sales • John Czerwonka, Jeff Park, Roland Minogue, Ken Williams, Bob Biehler, J. Lind • Marketing • Tina Settecase, Gregg Schweir, Mark Ayers, Sunil Palakodati • Operations • Bob Terhune, Chris Winans, Dave Saylor • Finance • Jay Potter, Doug Bennett • IT/Customer Service • Tom Luttrell, Dave Mills
Management of the process • MOS objectives are reviewed monthly at each level • Countermeasures are required for each target miss (red area) • Action Plans reviewed more frequently by project teams • KPIs are reviewed at least monthly • Some may be reviewed daily/weekly • May be best to post in appropriate work area • Expectation is to meet goals . . . if you miss, you should be able to explain why • Utilize lean problem-solving skills • “Speak with data”
Enabling Management Processes Do (Action Plan) Plan (MOS Matrix) Act (Countermeasure) Check (Bowling Chart)
Next Steps • Finalize 2nd Level Matrix after reviewing AOP • Determine “points of impact” for your business and develop any required 3rd Level Matrices • Establish Bowling Charts and Actions Plans with your staff • Establish a monthly schedule to review results from each period • The Lean/PIT group can be available for coaching • Expectation is to deploy to all salaried employees by January 31 • Organization survey will be conducted to validate