Download
1 / 48
480 likes | 589 Views
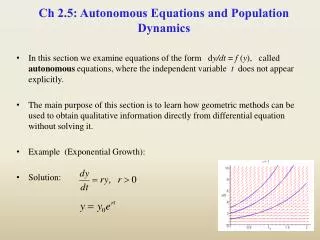
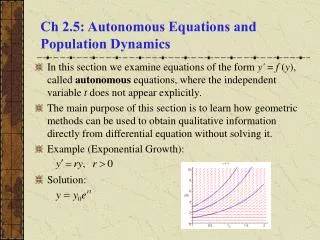
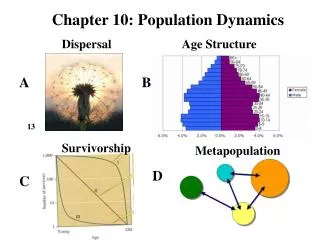
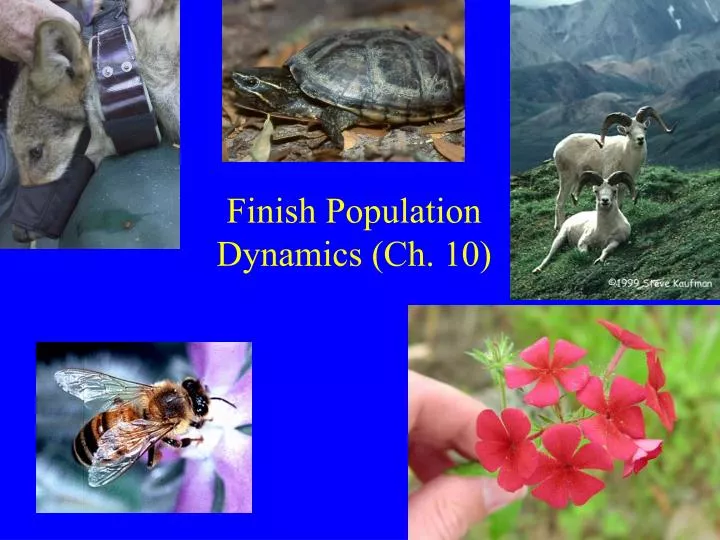
Finish Population Dynamics (Ch. 10). Fecundity Schedule for Phlox drummondii. n x = number survivors. l x = survivorship. m x = Age-specific fecundity : Average number seeds produced by individual in age category. Fecundity Schedule for Phlox drummondii.

E N D
Fecundity Schedule for Phlox drummondii nx= number survivors lx= survivorship • mx= Age-specific fecundity: Average number seeds produced by individual in age category.
Fecundity Schedule for Phlox drummondii • mx = Age-specific fecundity: Average number seeds produced by individual in age category. • i.e. plants 300 days old produce on average 0.3394 seeds
Fecundity Schedule for Phlox drummondii • Ro= lxmx • x = age interval • lx = proportion pop. surviving to age x • mx = Age-specific fecundity: Average number seeds produced by individual in age category. Sum these!
Annual Plant • Phlox drummondii (hermaphrodite) • Ro = Net reproductive rate; Average number seeds produced by individual during life • If > 1, population increasing • If = 1, population stable • If < 1, population declining
Annual Plant Is pop. stable, increasing, decreasing?
Annual Plant • Non-overlapping generations: can estimate growth rate (per unit time). • Geometric Rate of Increase, lambda ():
Annual Plant • Non-overlapping generations: can estimate growth rate. • Geometric Rate of Increase, lambda (): • = Nt+1 / Nt • Nt+1 = Size population future time • Nt = Size population earlier time
Annual Plant • Geometric Rate of Increase, lambda (): • Start 996 plants: 2.4177 seeds/individual (Table 10.1) • 996 x 2.4177 = 2,408 seeds start next year • = Nt+1 / Nt • = 2,408 / 996 • = 2.41 • = Rofor annual plant (generations do not overlap & reproduction not continuous)
Estimating Rates when Generations Overlap Who am I? Hermaphrodite?
Estimating Rates when Generations Overlap • Common Mud Turtle (Kinosternon subrubrum) • Data: • survivorship in age class (years) • reproductive info for each age class
How can a turtle reproduce? • Need Females! Population mix males & females • Not all reproduce • Clutch Size: # eggs laid by female/nest • How many nests/year (or time period)? mx= (% fem) x (% reproducing) x (clutch size) x (# nests)
Table 10.2 • Trick: Pop. has males & females, so calculate production females by females
Sum col. 4 in Table 10.2 (lxmx), R0 = 0.601 • Stable, increasing, decreasing?
Other population parameters • Common Mud Turtle • Average generation time (T): Average time from egg to egg between generations
Fecundity Schedule for Kinosternon subrubrum • T= xlxmx /Ro • x = age interval • lx = proportion pop. surviving to age x • mx = Age-specific fecundity: Average number eggs/seeds produced by individual in age category. Sum these!
Table 10.2: • T = 6.4 / 0.601 = 10.6 years • T = xlxmx / Ro
Other population parameters • Common Mud Turtle • Per Capita Rate of Increase (r) • r = rate population change per individual per unit time r = (ln Ro) / T • ln = natural log • Also: • r is births per individual per unit time (b) minus deaths per individual per unit time (d) • r = b - d
Estimating Rates when Generations Overlap • Common Mud Turtle r = (ln Ro) / T r = ln (0.601) / 10.6 r = -0.05 • rate population change per individual per unit time If r > 0, population increasing If r = 0, population stable If r < 0, population declining • Makes sense: • r = b - d
Organism Size and Population Density • A search for patterns………….(recall size vs. density) hi population density (log) lo lo hi body size (log)
Organism Size and Population Density • A search for patterns………….(recall size vs. density) • Generation time vs. size? • Also log-log scale Size Gen time (T)
Generation time vs. size • Positive slope • Log-log scale
Use of population dynamics info • Control invasive species (who am I?) 2008 map
Use of population dynamics info • Prevent extinction rare species (who are we?) 200 or fewer individuals in wild
Use of population dynamics info • Managing harvested species • Ex, orange roughy New Zealand Fishery areas Slimehead family!
Use of population dynamics info • Long lived (150 years) • Breed when 25-30 yr old • Harvest only large fish (allow some to breed)?
Population Density Emigration Immigration
Dispersal • Important to population dynamics • Immigration: add individuals • Emigration: lose individuals
Dispersal • Hard to study: • 1) tracking movements adults • 2) dispersal phase may be small wolf Bee!
Dispersal • Africanized Honeybees • Killer bees...
Dispersal • Africanized Honeybees • Honeybees (Apis mellifera) • subspecies • Africanized disperse faster than European honeybees.
Dispersal • Africanized Honeybees
They are Here!! • First in Mobile AL, Aug 2004! • 28 US fatalities 2010 near Albany GA Aug 2004, first
When Do Organisms Disperse? • Eggs/ Sperm/ Seed (e.g. pollen, soft corals, burrs) • Larvae/Juveniles (e.g. Corals, Fish, spiders) • Adults (e.g. Cats, Butterflies, birds) Immobile adults must disperse as Juveniles, Zygotes or Gametes!
Dispersal & Climate Change • Organisms spread northward 16,000 years ago (retreat of glaciers) • Evidence: preserved pollen in sediments.
Changes in Response to Climate Change • Tree species: Movement slow 100 - 400 m/yr. Fig. 10.6
Climate envelope: area with appropriate climate conditions American Pika (Ochotona princeps)
Climate Change Torreya taxifolia • Climate envelope: area with appropriate climate conditions • Will envelopes move too fast? • Assisted migration: human help to prevent extinctions
Dispersal in Response to Changing Food Supply • Holling: numerical responses to increased prey • Increased prey density led to increased predator density This figure from Ch. 7 showed functional responses
Dispersal in Response to Changing Food Supply • Numerical response: dispersal + increased reproduction Kestrel Owl Vole
Dispersal in Response to Changing Food Supply • Predators moved to areas of more dense prey Fig. 10.7
Dispersal in Rivers and Streams • Current (flow of water) causes drift (movement downstream) • Adaptations to maintain position: • 1) Streamlined bodies/strong swimmers Jumping salmon
Dispersal in Rivers and Streams • Adaptations to maintain position: • 2) Bottom-dwelling: avoid current • 3) Adhesion: hang on! Etowah darter Alabama hogsucker
Dispersal in Rivers and Streams • Still get washed downstream in flash floods (spates). James River VA, 1985
Dispersal in Rivers and Streams • Colonization cycle: interplay downstream & upstream dispersal
Dispersal in Rivers and Streams • Cool story: Costa Rican river snail moves upstream in migratory wave (to 1/2 million snails!)