Download
1 / 11
280 likes | 1.2k Views
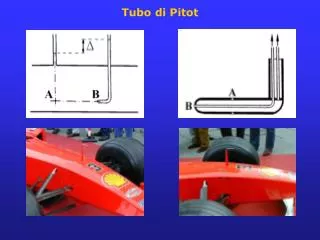
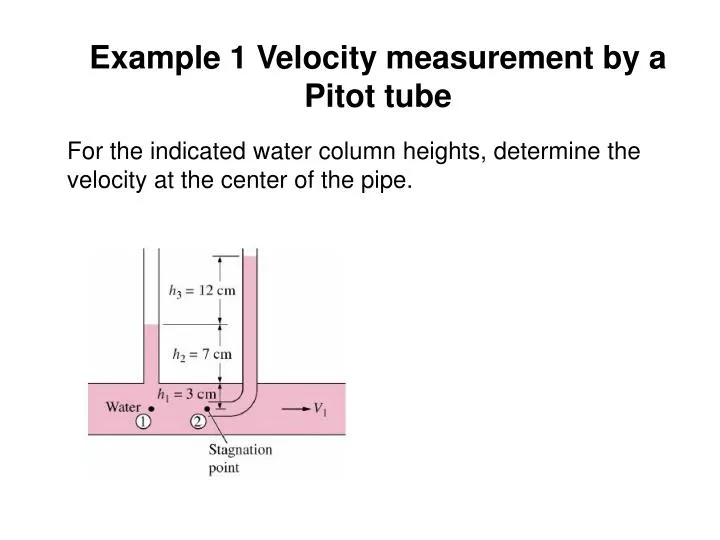
Example 1 Velocity measurement by a Pitot tube. For the indicated water column heights, determine the velocity at the center of the pipe.

E N D
Example 1 Velocity measurement by a Pitot tube For the indicated water column heights, determine the velocity at the center of the pipe.
Confined Flows: Pressure can not be prescribed a priori:Examples are nozzles and pipes of variable diameter forwhich the fluid velocity changes as the flow area is differentfrom one section to other. Figure 3.15 (p. 115) Steady flow into and out of a tank.
A stream of water diameter d=0.1 m flows steadily from atank of diameter D=1.0 m. Determine the flow rate, Q, needed from the inflow pipe if the water depth remains constant, h =2.0 m Figure E3.7 (p. 115)
Some facts from Bernoulli’s equation • An increase in velocity is accompanied by a decrease in pressure • Considerable differences in velocity correspond to considerable drop in pressure, for flows of gases, this can create compressibility effects. For liquids, this may create cavitation, a potential dangerous situation. • Hissing sound in the garden hose is due to cavitation if the hose is kinked. • Collapse of cavitation bubbles can create pressures as large as 100,000 psi
Figure 3.16 (p. 119) Pressure variation and cavitation in a variable area pipe.
Siphon effect: a siphon is a continuous tube that allows liquid to drain from a reservoir through an intermediate point that is higher than the reservoir, the flow is driven by hydrostatic pressure without any pumping. The final end of the tube should be lower than the liquid surface in the reservoir. Figure E3.10a (p. 120)
Example 2 Siphoning Out Gasoline From a Fuel Tank The point 2 is located 0.75 m below point 1, and point 3 is located 2 m above point 1.The siphon diameter is 5 mm. Determine (a) the minimum time to withdraw 4L of gasoline from the tank to the can, (b) The pressure at point 3. The density of gasoline is 750 kg/m3.
Ideal flow meters Flow is horizontal, steady, inviscid And incompressible Figure 3.18 (p. 121) Typical devices for measuring flowrate in pipes.
Example 3. Kerosene flows through venturi meter • Figure E3.11 (p. 122)
Correction for Frictional Loss • Some pressure losses around the constriction occurs: causing lower velocity than expected • Fluid stream will continue to contract past the obstruction; vena contracta area is less than the flow area of the obstruction • Both losses can be accounted for by incorporating a correction factor called the discharge coefficient, Cd <1, and is determined experimentally.
Discharge Coefficient, Cd Most widely used flow meters are, orifice meters, flow nozzles and venturi meters Orifice meters: Nozzle meters: These relations are valid for 0.25<β<0.75; 104 <Re <107