Download
1 / 17
180 likes | 297 Views
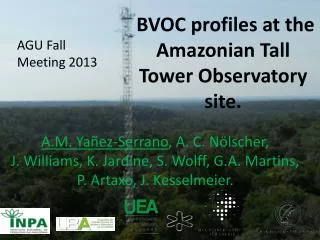
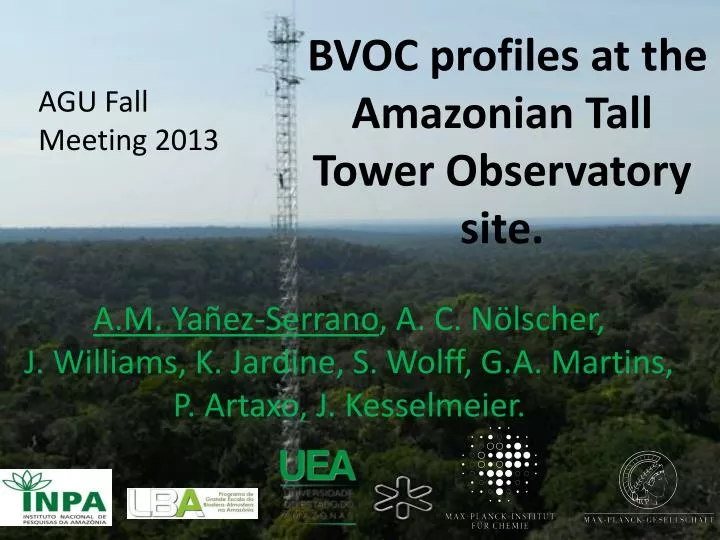
AGU Fall Meeting 2013. BVOC profiles at the Amazonian Tall Tower Observatory site. A.M. Yañez -Serrano , A. C. Nölscher , J. Williams, K. Jardine, S. Wolff, G.A. Martins, P. Artaxo , J. Kesselmeier . The Amazon Rainforest. Tropical photoreactor

E N D
AGU Fall Meeting 2013 BVOC profiles at the Amazonian Tall Tower Observatory site. A.M. Yañez-Serrano, A. C. Nölscher, J. Williams, K. Jardine, S. Wolff, G.A. Martins, P. Artaxo, J. Kesselmeier.
The Amazon Rainforest • Tropical photoreactor • High temperatures • High solar radiation • High humidity • High forest-atmosphere interactions • There is a strong coupling between the atmosphere and the biosphere via the hydrological cycle, radiation balance and nutrient cycles among others. • The Amazon is 50% of the world’s tropical rainforest – High density of biomass
Radiative Properties Ozone CO CH4 Condensable vapours Secondary Organic aerosol Organic Aerosol CCN • Oxidation • OH • O3 • NO3 rain Isoprene Monoterpenes Oxygenated VOC Other BVOC VOCs + NOx BVOC from vegetation BVOC from soil
ATTO: Amazonian Tall Tower Observatory 150 km NE of Manaus • Negligible influence from Manaus plume • Logistically viable Temperature 24-34ºC Main wind direct. NE Ozone 2-30 ppbV NO 0,3-0,7 ppbV S 02°08’38.8” W 58°59’59.5”
Sampling methodology 79m • Insulated heated Teflon lines • Flushing at all times 53m The 38m 24m 12m container 4m 0,5m 0,05m
PTR-MS Proton Transfer ReactionMassSpectrometer • Measures online VOCs at lowconcentrations. • Softchemicalionizationtechnique • Sampleisprotonized and massspectrometerdetectsselectedmasses +1.
Time of measurements Calibrated Compounds • February/March 2013 – WET SEASON • September 2013 - DRY SEASON
Isoprene – Monoterpene comparison to light and temperature driven emission algorithms
Conclusions • Patterns of isoprene and monoterpene concentrations seem to differ in relation to their emission capacities as indicated by emission algorithms. • May monoterpeneconcentrations partly be influenced by release from storage pools triggered by temperature only? • It seems that for late September 2013 the understory was more active than the top of the canopy for some compounds. • Isoprene oxidation products are directly related to the isoprene concentrations during the wet season. • Possible direct plant emission during the dry season as well? • Oxygenated compounds seem to be related to sources of both photochemical and biological origin, differing among seasons.