Download
1 / 65
670 likes | 831 Views
Unsupervised learning. Clustering using the k-means algorithm Avi Libster. clustering. Used when we have a very large data set with very high dimensionality and lots of complex structure. Basic assumption : attributes of the data are independent. Cluster Analysis.

E N D
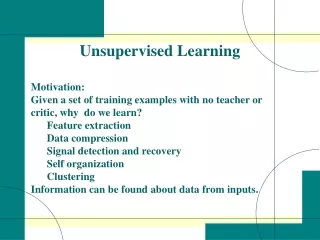
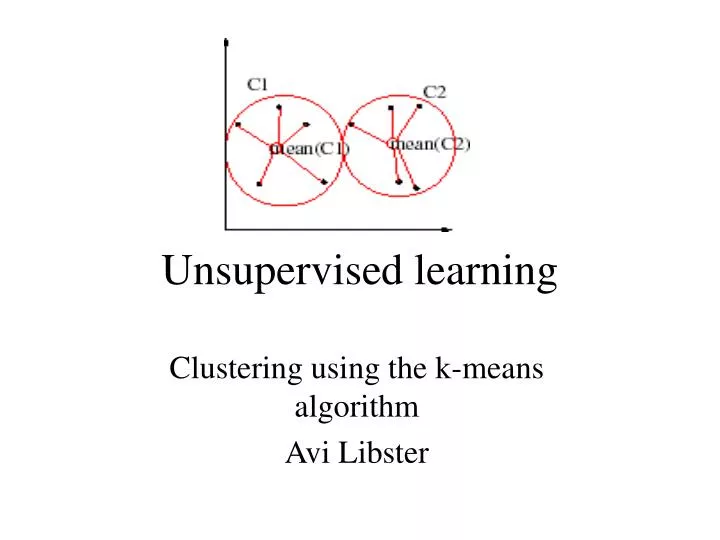
Unsupervised learning Clustering using the k-means algorithm Avi Libster
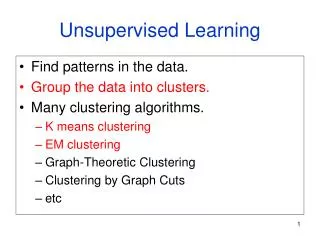
clustering • Used when we have a very large data set with very high dimensionality and lots of complex structure. • Basic assumption : attributes of the data are independent.
Cluster Analysis • Given a collection of data points in space ,which might be high dimensional one, the goal is to find structure in the data: organize that data into sensible groups, so that each group will contain points that are near in some sense. • We want points in the same cluster to have high intersimilarity and low outersimilarity compared to points from different clusters.
What is K-means • An unsupervised learning algorithm • Used for partitioning datasets. • Simple to use • Based on the minimization of the square error.
Basic K-means algorithm Begin Initialize n , k ,m1 .. mk do classify n samples according to nearest mi recompute mi until no change in mi return m1 … mk End The goal is to minimize E = ∑i=1,K∑vЄCid(μiv)
And now for something completely different… *Pictures * Adopted from http://www.cs.ucr.edu/~eamonn/teaching/cs170materials/MachineLearning3.ppt
k3 k1 k2 K-means Clustering: Step 1 N – points , 3 centers randomly chosen 5 4 3 2 1 0 0 1 2 3 4 5
k3 k1 k2 K-means Clustering: Step 2 Notice that the 3 centers divide the space into 3 parts 5 4 3 2 1 0 0 1 2 3 4 5
k3 k1 k2 K-means Clustering: Step 3 New centers are calculated according to the instances of each K. 5 4 3 2 1 0 0 1 2 3 4 5
k3 k1 k2 K-means Clustering: Step 4 Classifying each point to the new calculated K. 5 4 3 2 1 0 0 1 2 3 4 5
k1 k2 k3 K-means Clustering: Step 5 After classifying the points to previous K vector , calculating new one
Classic K-Means Strengths First and furthermost VERY easy to implement and understand. Nice results for a simple algorithm.
Classical K-Means - Strengths K-means can be viewed as a stochastic hill climbing procedure. we are looking for local optimum and not global optimum (as opposed to genetic or deterministic annealing algorithms which look for global optimum).
Why Hill climbing ? Actually Hill climbing can be a misleading term in this context. The hill climbing Is not done over the dataset points , but over the means values. When the k-means algorithm is running we actually change the values of the means (k of those). The changes of the means is somewhat dependent on each other.
Hill climbing continued… • The algorithm is said to converge when we don’t change the means values. • This happens when dmi/dt = 0. in the phase plane created from the means values we have reached the top of the hill (stable point or saddle point).
K-means Strengths continued… K-means complexity is easily derived from the algorithm : O(ndcT) n – number of samples d – number of features (usually the dimension of the samples) k – number of centers checked T – number of iterations When the datasets are not to large and of low dimensions the average time of running is not high.
Using K-means strengths The following are real life situations in which K-means is used as the key clustering algorithm. During the presentation of the samples, I would like to emphasize some important points considering the implementation of k-means.
Sample :Understanding Gene regulation using Expression array cluster analysis
Scheme of gene expression research Pairwise Measures Clustering Motif Searching/Network Construction Integrated Analysis (NMR/SNP/Clinic/….)
Gene Expression Clustering Normalized Expression Data Protein/protein complex Semantics of clusters: From co-expressed to co-regulated DNA regulatory elements
The meaning of gene clusters • genes that are consistently either up- or downregulated in given set of conditions. Down or upregulation may shade light on the causes of biological processes • patterns of gene expression and grouping genes into expression classes might provide much greater insight into their biological function and relevance.
Why should clusters emerge ? Genes contained in a particular pathway, or that respond to some environmental change , should be co-regulated and consequently, should show similar patterns of expression. from that fact one can see that the main goal is to identify genes which show similarpatterns of expressions. Examples: • If gene a expression is rising, gene b expression is rising too (might be because gene a encodes a protein which regulates the expression of b). • Gene a is always expressed with gene b (it might happen because of the co-regulation by same protein).
cDNA mRNA Treated RT and label with fluor dyes Control Mix and hybridize target to microarray • Spot (DNA probe): • known cDNA or • Oligo Classic MicroarrayExperiment
Measured Microarray raw data Measure amounts of green and red fluorescence. For each well 4 results are possible : • No color – the gene wasn’t expressed • Red color – the gene was expressed only by the control group • Green color – the gene was expressed only by the treated group • Yellow color – the gene was expressed by both of the control groups.Important conclusion : don’t let color blind people perform the test .
Data extraction Process • Adjust fluorescent intensities using standards (as necessary) • Calculate ratio of red to green fluorescence • Convert to log2 and round to integer • Values may be : saturated green=-2 to black = 0 to saturated red = 2
Input data for clustering • Genes in rows , conditions in columns. Condition can be seen as : exposure to specific environment, time , ect. Each column is one microarray test.
Why Data extraction process is relevant and important ? • Creating an easy to work with scale (-2 < x < 2) • more important k-means is sensitive to the measure units we chose, more correctly to linear transformations. Let’s demonstrate that :
What happens if we change the measurement unit to ft ? Height (cm) A B 190 180 170 C D 160 20 30 35 40 50 Age (year)
when the measurement units were changed, a very different clustering structure emerged. Height (ft) 7 B A 6 5 C D 4 35 36 37 38 39 40 Age (year)
How to overcome measure unit problems ? • It’s clear that if k-means algorithm is to be used the data should be normalized and standardized. let’s just have a brief look on the dataset structure …
Dataset structure We are dealing with a Multivariate Dataset composed of p variables (p microarrays tests done) for n independent observations (genes). We represent it using n x p matrix M consisting of vectors X1 through Xn each of length p.
Note: if this is done we are becoming sensitive to outliers. More of that in pitfalls of k-means section • Normalization: • Calculates the mean value of variables • a measure how well the of the ith variable is spread over the data • Mean absolute deviation
calculating covariance matrix will come handy later. The covariance matrix is PxP matrix.
before running k-means on the data it’s also a good idea to do mean centering. Mean centering reduces the effect of the variables with the largest values (column) , which obscure other important differences. but When applying the previous steps to the data you should be cautious. When data is being standardized it may cause some damages to the clusters structure , because of the reduced effects ,from variables with a big contribution, being divided by large sj.
Sample 1 sample 2 Gene a Gene b a1 a2 b1 b2 a1 Distance Sample 1 b1 a2 b2 Sample 2
Distance The way Distance is measured is of the highest importance to k-means algorithm. Using the distance function we aim to classify points to different centers. Distance should be a function with the following properties : 1. d(A,A) = 0 2. d(A,B) = d(B,A) 3. d(A,B) > 0
Distances example 1 Below are distances which are good to use when we are looking for similarities • Euclidean Distance • Manhattan Distance • Minkowski Distance • Weighted Euclidean Distance
denotes the number of common attributes between i and j Distances example 2 The following examples are a measure of dissimilarity : • Mahalanobis distance • Tanimoto distance Covariance matrix C (calculated before)
Pearson correlation coefficientthe most common distance measurement used in microarrays.
Effects of choosing distance function The ellipse was created using a distance function using the covariance matrix. it shows the 50% contour of a hypothetical population. B A Euclidean distances from the mean, of points a and b are equal but point B is clearly “more different” from the population than point A (it lies on the border of the ellipse).
Problems with K-means type algorithms • Clusters are approximately spherical • Local optimum may be incorrect and influenced by the choice of the first K means values • High dimensionality is a problem • The value of K is an input parameter • Sensitive to outliers
Clusters are approximately spherical • What happens if cluster is not spherical ? Also when k-means assumes the data to be spherical , it becomes sensitive to coordinate changes (i.e. weighting changes).
Average distance Min stance Max distance • What happens with non conventional structures ?