Download
1 / 26
260 likes | 280 Views
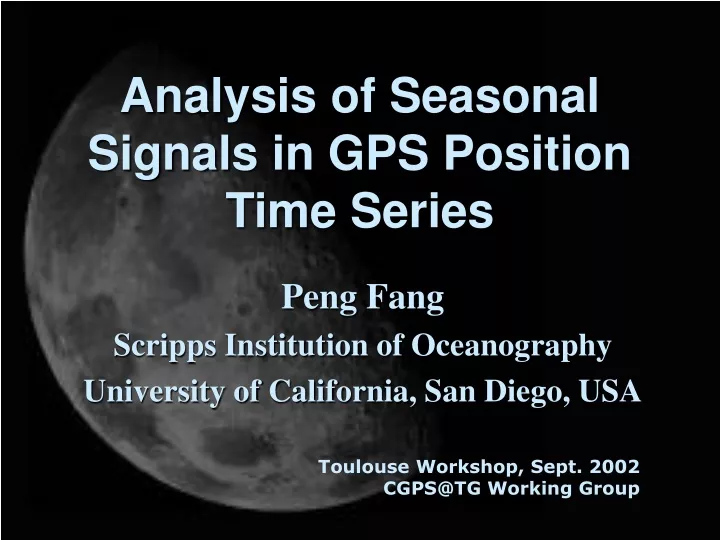
Analysis of Seasonal Signals in GPS Position Time Series. Peng Fang Scripps Institution of Oceanography University of California, San Diego, USA. Toulouse Workshop, Sept. 2002 CGPS@TG Working Group. Credit.

E N D
Analysis of Seasonal Signals in GPS Position Time Series Peng Fang Scripps Institution of Oceanography University of California, San Diego, USA Toulouse Workshop, Sept. 2002 CGPS@TG Working Group
Credit Anatomy of apparent seasonal variations from GPS-derived site position time series, JGR Vol. 107, No. B4, ETG 9-1, 2002 D. Dong, JPL, California Inst. of Technology, Pasadena, USA P. Fang, IGPP, SIO, Univ. of Calif. San Diego, La Jolla, USA Y. Bock, IGPP, SIO, Univ. of Calif. San Diego, La Jolla, USA M. K. Cheng, CSR, Univ. of Texas Austin, Austin, USA S. Miyazaki, Earthquake Res. Inst., Univ. of Tokyo, Tokyo, Japan
OUTLINE • Signal Categorization • Data • Processing • Analysis • Verification • Discussion and Summary
I. Gravitational excitation • Rotational displacements due to seasonal polar motion • Universal time corrected for polar motion (UT1) variation • Loading induced displacement due to solid Earth tides, ocean tides, and atmospheric tides • Pole tide
II. Thermal origin coupled with hydrodynamics • Atmospheric pressure, non-tidal sea surface fluctuations, and ground water (liquid and solid) • Thermal expansion of bedrock, and wind shear
III. Various errors • Satellite orbital models, atmospheric models, water vapor distribution models, phase center variation models, thermal noise of the antenna, local multi-path, and snow cover on the antenna
Data • Long observation history (>4.5 year time span starting from 1996) • Good geographical distribution 128 (out of 429 total) high quality sites are selected for the final analysis
Processing • Orbit/EOP tightly constrained • ITRF reference frame used • Distributed mode (subnetworks) • Tropospheric delay estimated • Antenna phase center corrected • Solid Earth tide removed • GAMIT/Globk software
Analysis • Parameters for each component at each site with t0 = 1996.0: • Bias • Velocity • Aannualsin(w(t-t0) + fannual) • Asemiannualsin(w(t-t0) + fsemiannual) Offsets due to earthquake or instrument setup change are treated separately
Resulting Time Series • Vertical: 4-10mm formal error 1mm • Horizontal: 1-3mm formal error 0.5mm • Annual phase (Vertical): 5-10o • Annual phase (Horizontal): 7-15o These are typical signal range
Phases are counted counterclockwise from east Ellipses represent 95% confidence level
Seasonal Terms • Pole Tide McCarthy, 1996 dl = 9.0 cos q (xp sin l + yp cos l) dq = -9.0 cos 2q (xp cos l - yp sin l) dr = -32.0 sin 2q (xp cos l - yp sin l) qis colatitude Be very careful with the sign of dq, positive for SOUTH
Seasonal Terms (Cont.) • Ocean tide Scherneck, 1991 Coefficients of11 tides (amp. & phases): M2, S2, N2, K2, K1, O1, P1, Q1, MF, MM, SSA Mostly vertical, typically in mm range
Seasonal Terms (Cont.) • Atmospheric mass loading Farrell, 1972, vanDam and Wahr, 1987 Green function approach Re-analysis of surface pressure by National Center for Environment Prediction (NCEP), 6 hour sampling Inverted barometer (IB) model ECMWF land-ocean mask model Horizontal < 0.5mm Vertical < 1.0 mm typical Eurasian, Arabian Peninsula ~ 4.0 mm
Seasonal Terms (Cont.) • Non-tidal ocean mass loading Interaction of surface wind, atmospheric pressure, heat and moisture exchange, hydrodynamics Time-varying ocean topography from TOPEX/Poseidon altimeter, 1x1o 10 days, Tapley, 1994 Correction term: seasonal steric variation due to salinity and temperature variations above thermocline (no contribution to mass variation). Dynamic Height <-Specific volume anomaly (Gill, 1982) <- WOA-94 model (Levitus and Boyer, 1994) with 19 depths. Vertical: Typical 1mm, low latitude islands/coasts 2-3mm
Seasonal Terms (Cont.) • Snow/soil moisture mass loading Snow cover/soil moisture model NCEP/DOE reanalysis (Kanamitsu et al, 1999, Roads et al, 1999) <- Climate Data Assimilation System-1 reanalysis NCEP/NCAR + adjusted soil moisture from Climate Prediction Center Merged Analysis of Precipitation (CMAP) Ice/snow capped reg. treated separately Vertical: BRAZ 7mm, most 2-3mm, island sites submm (underestimated due to model problem)
Terms not counted for • Atmospheric modeling • Imperfect, separate studies • Bedrock thermal expansion • Appendix B, 0.5mm, 45o behind • Phase center & environmental factor • HOLP example, Hatanaka, 2001 • Glacier surge & internal ice flow • Alaska region, Sauber et al, 2000 • Antarctica, Cazenave et al, 2000 Note: Signal may not be sinusoidal
Verification • JPL solution (GIPSY) • GEONET solution (Bernese) Different data processing methods
Summary • The modeled loading and nonloading terms can explain 66% (if pole tide is included) or 42% (pole tide excluded) the observed power (mean amplitude squared). • Some candidate terms for the residual signal are proposed. • Impact on other related geodetic and geophysical problems are discussed.
Atmosphere (purple arrow), non-tidal ocean (red arrow), snow (green arrow) and soil wetness (blue arrow) caused vertical annual variations of site coordinates.