Download
1 / 53
530 likes | 548 Views
This study explores the validity of cardiovascular disease (CVD) risk factors and outcomes in electronic health records (EHRs), specifically looking at the Medical Expenditure Survey Array (MESA) and the Chicago Health Atlas data. It highlights the advantages of using EHRs over CMS data, the opportunities offered by Health Information Exchanges (HIE), and the potential to link EHR data from multiple institutions. The study also discusses the goals and design considerations of the Chicago Health Atlas and the use of hash functions to protect patient information. It concludes by discussing the potential of linking MESA data with the Chicago Health Atlas for CVD research.

E N D
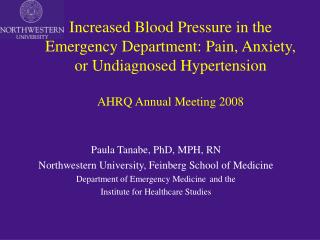
The Validity of CVD Risk Factors and Outcomes in Electronic Health Records: Preliminary Findings from MESA and the Chicago Health Atlas Norrina Allen, PhD, MPH and Abel Kho, MD Feinberg School of Medicine Northwestern University
EHRs: A Valuable Resource for Epi • Advantages over CMS – (1) not just admin/billing data (include lab, clinical, medication); (2) all ages • Increasing penetration of EHRs • EHRs now being linked together (Health Information Exchanges) • These HIE offer new opportunities in CVD research • Identification of participants (eCohorts and clinical trials) • More generalizable and representative population • More efficient outcomes ascertainment and follow-up
Chicago Facts • Third most populous city in the U.S. • 2.7 million people, 10 million in metropolitan area. • Multiple large medical centers with robust EHRs • One of the most segregated metropolitan areas with associated health disparities • South and Southwest sides* *Yonek, J., Hasnain-Wynia, R. A Profile of Health and Health Resources within Chicago’s 77 Communities. Northwestern University Feinberg School of Medicine, Center for Healthcare Equity/Institute for Healthcare Studies, 2011
The Goals of the Chicago Health Atlas • Create a technical framework to integrate EHR data across multiple institutions • Shared data resource to provide insight to policy makers, researchers, and public health officials on the health of the Chicago community and identify opportunities to improve care.
Design Considerations • Limit sharing of any protected health information • Yet account for care of the same patient at multiple institutions • Protect anonymity of patients/providers/institutions • Enable linkage to new information and sources as it becomes available • Patient level • Geographic location
Methods • Coordinated IRB approval across multiple institutions (ongoing/never ending). • Adults aged 18-89 • Limited to structured data, no free text • Focus on 606xx zip codes, with known overlapping care institutions and high population density • Defined a data dictionary (Demographics, diagnoses, laboratory tests, medications, vital signs) • Instead of an EMPI, create a lightweight software application to pass identifiers through a standard set of preprocessing steps, and then “hash” the data
What’s a hash? • Hash functions commonly used for secure transactions in e-commerce • One way function – can take variable input and produced a fixed size output • Deterministic– same input always produces same output • Destructive – Can’t reverse engineer the input from the output http://csrc.nist.gov/publications/nistbul/b-May-2008.pdf
Updated Hash Method • Second generation Hash, SHA-512* (512 bit) • Creates 5 hash IDs (with probability weights) depending on availability of last name, first name, date of birth (DOB), gender, SSN.
Preliminary SHA-1 Single Institution Validation SHA1 20802322ED366A1EFD562A6219C4D7AF993BADAD WilliamGalanter22732M123456789 5-Variable Hash Concatenate WilliamGalanter22732M123456789 4-Variable Hash Concatenate & SHA1 12345678901234567890123456789012345 • Galanter WL, Applebaum A, Boddipalli V, Kho A, Lin M, Meltzer D, Roberts A, Trick B, Walton SM, Lambert BL. Migration of patients between five urban teaching hospitals in Chicago. J Med Syst. 2013 Apr;37(2):9930. PMID 23381645
Diabetes(250.xx) Honest Broker Institution A johnodwyer06121970987654329m JohnO’Dwyer6/12/1970987-65-4329M Hash Pre - Fxn Process Replace StudyID Matched 250 . xx HashIDs with 401.xx Unique JohnO dwyer6/12/70male StudyID johnodwyer06121970m Hash ID-1Hash ID-2Hash ID-3Hash ID-4Hash ID-5 Hash ID-1Hash ID-2Hash ID-3Hash ID-4Hash ID-5 Hash Pre - Fxn Process Institution B HTN(401.xx)
Current Data as of Sept. 2013 Includes over 5.7 million unique patients (including over 1.2 million primary care patients)
Age distribution comparison, 2010 Percent Age groups
Geographic coverageby residential ZIP Percent= # of patients with visit in 2010 2010 Census population Additional text
Diabetes prevalence estimateby residential ZIP Percent= # of patients with > 1 diabetes mellitus diagnosis code or lab criteria met # of patients with visit in 2006-2010
Rationale for Linkage with MESA • EHR data has been compared with data from paper charts; lack of a gold standard to determine the validity of EHR data for CVD research • MESA provides a rich source of rigorously collected data and outcomes; Could serve as the “gold standard” comparison for data collected in the EHRs • In addition, there is the potential to expand the types of outcomes collected by MESA or catch “missed” events
Timeline Jan. 2006 Dec. 2012 Health Atlas MESA Study Exam 1 Jul 2000-Aug 2002 Exam 2 Sep 2002-Feb 2004 Exam 5 Apr. 2010-Feb 2012 Exam 3 Mar 2004-Sep 2005 Exam 4 Sep 2005-May 2007
Outcomes: Events • ICD-9 codes in EHR were compared to adjudicated events in MESA • MI (ICD-9 410) • Stroke (ICD-9 430-438) • CHD (ICD-9 410-414, 429.2) • CVD (ICD-9 390 to 459, 745 to 747)
Outcomes: Risk Factors • ICD-9 codes in EHR were compared diagnosis of diabetes, HTN, or obesity at either exam 4 or 5 • Diabetes (ICD-9 250) • Hypertension (ICD-9 278) • Obesity (ICD-9 401-404)
Outcomes: Anthropometric Data • Examined continuously • Calculated correlation between the avg. EHR measure and the MESA exam 5 value • Weight (lbs) • BMI • SBP • DBP
Methods • Excluded events prior to start of Health Atlas data • within 1980 days (time between July 2000 until Jan 2006) of follow-up • Don’t have exact date of exams or date of event • When comparing anthropometric data: • Took the average in the health record for the 2 yrs during which the yr 5 exam took place • Ideally we would know the participants exam date and then look within specific time windows and by the number of measures available • And compared it to the exam 5 measures
MESA Linkage • Created hash IDs for 1164 MESA ppts from NU • Identified encounters for 949 ppts (81.5%) between 2006-2012 • On avg. ppts have encounters in 13 mos (SD 12.1, min 2-66) out of 84 months (Jan 2006-Dec 2012) or 15% of the 7 yr follow-up • Within each month they avg. 1.5 encounters (SD 1.1, range 1-14)
MESA Participants were seen across multiple healthcare systems within the Health Atlas 17% of ppts were seen at 2+ institutions
Site of Participant Encounters Number of MESA Participants
MI • 3 MIs identified can not be explained by loss to follow-up • The one concordant MI was dropped because time to MI was 1784 (may have been recruited later)
CVD • Much of these CVD “events” identified by the health atlas are likely reflects prevalent CVD • Reminder, these “events” reflect both primary care and acute care hospitalizations therefore we will need to work to restrict the health atlas “events” to hospitalizations with a primary discharge diagnosis
Diabetes *Diabetes in MESA was defined as diabetes diagnosis by 2003 ADA fasting criteria algorithm at exams 4 or 5
Obesity *Obesity in MESA was defined as having a BMI >30 at exams 4 or 5
Hypertension *Hypertension in MESA was defined by the JNC VI (1997) criteria at exams 4 or 5
Weight • 270 ppts had vitals data with weight • Avg 7.3 weight measurements per person between 4/10-2/12 (range 2-56) • correlation with exam 5 weight was 0.97
BMI • 261 ppts had vitals data with BMI • Avg 6.9 BMI measurements per person between 4/10-2/12 (range 2-52) • correlation with exam 5 BMI was 0.97
SBP • 311 ppts had vitals data with SBP • Avg 19.6 SBP readings per person between 4/10-2/12 (range 2-495) • correlation with exam 5 SBP was 0.3
DBP • 311 ppts had vitals data with SBP • Avg 19.6 DBP readings per person between 4/10-2/12 (range 2-494) • correlation with exam 5 DBP was 0.5
Preliminary Conclusions • We appear to find additional events when using the EHR data • Although we are still investigating where along the path these events were “missed” (i.e. not reported, did not receive records, were not adjudicated as event) • Anthropometric data appear to be valid within the health atlas • And will likely be better when we can use comparable time periods
Next Steps • Need to examine the timing of encounters in Health Atlas with MESA exams and outcomes • Will need data from coordinating center on data of exams for each participant • Further explore the reasons for the discordant outcomes • Not reported by participant • Reported, but not adjudicated as an event • Seen at a hospital not covered in the Health Atlas • Incorporate lab values and medications into outcomes definitions within the health atlas
Potential Limitations for Future Uses • The Health Atlas in Chicago is unique in its coverage rate and ability to link individual patients – most of the country remains uncovered by HIE • However, now is the time to develop the methodology and validation • Works well for populations with more frequent health care encounters (such as older MESA participants) and for outcomes for which they would seek care
Future Directions • Keep improving Hash and Match software • Handling clinical data more efficiently • Integrating multiple additional data sources and sites • E.g. primary care clinics (Chicago Health IT Regional Extension Center)
Acknowledgements • MESA Coordinating Center • Richard Kronmal, Craig Johnson and Martin Schmitz • MESA Staff at Northwestern • Grace Ho • Kiang Liu, PhD – NU Site PI
Chicago Health Atlas Acknowledgements • PI: Abel Kho, MD – Dept of GIM; Northwestern • Funders: Otho S.A. Sprague Institute, Northwestern Memorial Hospital Community Engagement • Chicago Community Trust: Daniel X. O’Neil, Derek Eder • Chicago Department of Public Health: Eric Jones, Bechara Choucair
Chicago Health Atlas Team • Northwestern University: John Cashy, Anna Roberts, Sara Lake • UIC: Bill Galanter, John Lazaro • Cook County Hospital and Clinics: Bala Hota, Amanda Grasso • University of Chicago Medical Center: Chris Lyttle, Ben Vekhter, David Meltzer • Alliance of Chicago: Erin Kaleba, Fred Rachman, Jermaine Dellahousaye • Rush University Medical Center: Shannon Sims, Aaron Tabor • Vanderbilt University: Brad Malin • UIC Intern team: Ariadna Garcia, Pravin Babu Karuppaiah, Shazia Sathar, Ulas Keles (Sid Battacharya, Faculty mentor) • Becker Friedman Institute: Jörn Boehnke, John Eric Humphries, Scott Kominers
Hypertension prevalence estimateby residential ZIP Percent= # of patients with > 1 hypertension diagnosis code # of patients with visit in 2006-2010