Download
1 / 20
200 likes | 327 Views
Measuring the Poverty Effects of Higher Food Prices. Rafael de Hoyos DECPG Washington DC, October 2, 2008. Motivation. From January 2002 to February 2008 the WB global “real” food price index rose 140 %

E N D
Measuring the Poverty Effects of Higher Food Prices Rafael de Hoyos DECPG Washington DC, October 2, 2008
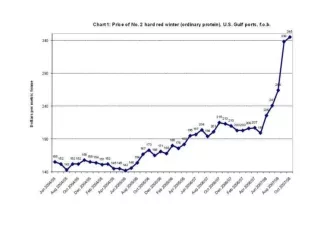
Motivation • From January 2002 to February 2008 the WB global “real” food price index rose 140 % • The massive increase in food prices have important redistributive and poverty impacts around the world • What are the (simple) methods available to measure the poverty effects?
Motivation • 75% of the world’s poor live in “agricultural households” • An increase in food prices can increase the income of the poorest households • Therefore, the global poverty effects of an increase in food prices are not clear • Objective: show the possible poverty effects of the recent changes in food prices Source: Bussolo, De Hoyos and Medvedev (2008)
Outline • Food Prices and Poverty: Conceptual Links • International vs. Domestic Food Prices • Simulation Results using the Global Income Distribution Dynamics (GIDD) dataset • Change in the Urban Poverty Deficit • National Poverty (headcount and gap) Effects • Limitations
International vs. Domestic Food Prices Is the increase in international food prices a good indicator of the reduction in purchasing power suffered by consumers in developing countries?
International vs. Domestic Food PricesNominal Cumulative Increase (LCU, Jan 2005 – Dec 2007)
International vs. Domestic Food PricesRelative Cumulative Increase (LCU, Jan 2005 – Dec 2007)
Measuring the Urban Poverty Effects Change in the Poverty Deficit (Dessus, Herrera, de Hoyos, 2008): Old Poor New Poor • The change in PD can be approximated by the following equation:
Data Requirements • Household survey data: • Household welfare aggregate • Food share • Rural/urban households classification • Domestic change in CPI, and food CPI • Elasticity of Substitution
Results from Dessus et al. (2008) 90% of the increase in PD is due to the “old poor”
Poverty Effects: Including Rural Households Real income can be defined as follows (De Hoyos and Medvedev, 2008): if : then: Which simplifies to: Share of Total Household Budget Spent on Food Share of Income from Agricultural Activities
Data used in De Hoyos and Medvedev (2008) • Household survey data for 73 developing countries coming from the GIDD • Food share observed for 21 countries and imputed for the rest using Engel curves (De Hoyos and Lessem, 2008) • Agricultural income shares observed for 19 countries (RIGA project) and imputed for the rest using polynomial regressions • Domestic CPI, and food CPI for period Jan. 2005 to Dec. 2007 coming from ILO. • All the simulations are based on changes in relative food prices
Results: Total Poverty Effects The change in the headcount implies an extra 155 million under the poverty line and an increase in 7% in the poverty deficit
Results: Total Poverty Effects • Large heterogeneity across countries
Limitations • Which price shock should we use? Nominal, real, relative? • Focusing on food CPI instead of particular commodities could hide important price effects within the food basket. • More country-specific information on the % of total income that is coming from agricultural self-employed activities rural households • General equilibrium effects? Substitution effects are important.