Download
1 / 14
340 likes | 717 Views
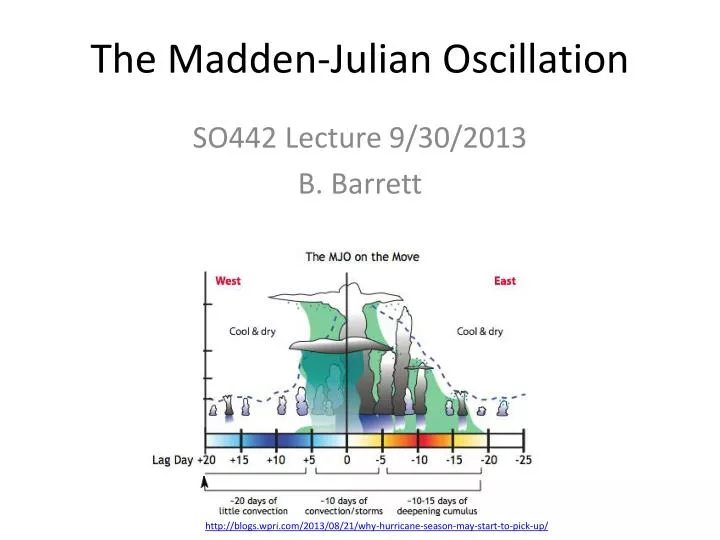
The Madden-Julian Oscillation. SO442 Lecture 9/30/2013 B. Barrett. http://blogs.wpri.com/2013/08/21/why-hurricane-season-may-start-to-pick-up/. First, atmospheric oscillations. The weather we notice here in Annapolis today is really the combination of many atmospheric oscillations

E N D
The Madden-Julian Oscillation SO442 Lecture 9/30/2013 B. Barrett http://blogs.wpri.com/2013/08/21/why-hurricane-season-may-start-to-pick-up/
First, atmospheric oscillations • The weather we notice here in Annapolis today is really the combination of many atmospheric oscillations • Diurnal, synoptic-scale (passage of fronts, for example), intraseasonal, seasonal, interannual (El Niño, for example) • Owing to the superposition principle, sometimes these oscillations combine with the same sign (“constructive interference”), other times with the opposite sign (“destructive interference”) • Example: a cold front passes during a clear afternoon. The “cold air” doesn’t seem so cold because it’s heated by the sun • Example of superposition: • El Niño/La Niña (top curve) • Front passages (middle curve) • Day-night cycle (bottom curve) Adapted from http://www.ipod.org.uk
Real life atmospheric superposition Temperatures (top panel), rainfall (middle panel), and snowfall (bottom panel), at BWI from Jan-Sept 2013 Note the variability: diurnal, synoptic, and seasonal How much, if any, of the variability in temperature, rainfall, and snowfall is due to the MJO? http://www.erh.noaa.gov/er/lwx/climate/cliplot/KBWI2013plot.png
What is the MJO? • An eastward-propagating, equatorially trapped, planetary-scale circulation envelope that drives (and is driven by) tropical convection on timescales of 30-60 days http://www.met.reading.ac.uk/~pete/mjo.html
What is the MJO? • Eastward propagating • Moves to the east • Moves east and not west because of the rotation of the Earth http://www.calclim.dri.edu/ccw200606.html
What is the MJO? • Equatorially trapped • Coriolis accelerations are zero at the equator, and increase poleward (so beta, the derivative of Coriolis, is large) • Air moving to the north is deflected to the right (east and south) • Air moving to the south is deflected to the left (still to the east!, and north) • Thus, any air parcels embedded in the MJO near the equator that move poleward as they head toward the east will return toward the equator due to Coriolis Idealized example of an equatorially trapped wave. Note the trough (L) and ridge (H) structure of the wave http://www.rsmas.miami.edu/users/isavelyev/GFD-2/EquatorialWaveTheory.pdf
What is the MJO? • Planetary scale • Covers the entire planet • Contrast to synoptic scale (a 500-mb trough the size of the U.S.), meso-scale (a hurricane the size of the mid-Atlantic states), local-scale (land-sea breezes at the Severn River of Annapolis) • “Wavenumber 1” • As you go around the planet, there would be one ridge and one trough Example of wavenumber-4 height patterns (red for the ridges, blue for the troughs. As you go around the planet, there are 4 red and 4 blue sections in each hemisphere. This time around, the waves are also “mixed” across the equator http://www.sciencedirect.com/science/article/pii/S1364682611003191
What is the MJO? • Drives (controls) areas of enhanced and suppressed tropical thunderstorm activity • “Areas” are huge: i.e., ½ of the equator zone would fall under “enhanced” and the other half under “suppressed” From Madden and Julian (1972)
What is the MJO? • Intraseasonal time scale: 30-60 days • Takes the wavenumber-1 wave between 30-60 days to make one circumnavigation around the world at the equator
Detecting and quantifying the MJO • Madden and Julian (1972) divided the MJO into eight “phases” (lettered A-H) based on where thunderstorms were favored • Wheeler and Hendon (2004) went about a much more rigorous definition of where is the MJO? • Their daily index regresses Outgoing Longwave Radiation (OLR) and 250-mb winds along the equator • Regression gives 2 numbers: RMM1 and RMM2. WH04 developed a nifty phase-space diagram to use RMM1 and RMM2 to locate the center of active MJO
Effects of the MJO • The clearest effect of MJO is on tropical convection around the equator. • But what actually causes there to be more (or elss) thunderstorms? • MJO affects upper-level wind and sea level pressure http://www-das.uwyo.edu/~geerts/cwx/notes/chap12/mjo.html Sea level pressure 100-mb wind http://www.meted.ucar.edu/climate/mjo/print.htm
Some current questions • Can the MJO modify the northern hemisphere wave train (aka the jet stream)? • If so, what would the impacts be? • How about the southern hemisphere? http://www.climas.arizona.edu/feature-articles/february-2012
Some current questions http://www.cpc.ncep.noaa.gov/products/precip/CWlink/MJO/Composites/Temperature/ MJO effects on surface pressure and circulation, around the globe Phase-by-phase impacts on U.S. wintertime surface temperature
Task for Wednesday 10/2 • In groups of about 3 students: • Summarize effects of the MJO on a variety of sensible weather (weather that we humans, at the surface of the Earth, notice) • Presentations of about 10 minutes each • Primary source for each study: one peer-reviewed article • Article manuscripts hosted at: http://www.usna.edu/Users/oceano/barrett/tropical.htm