Download
1 / 46
460 likes | 578 Views
Massive Galaxies at high redshift. GOODS http://www.stsci.edu/science/goods Lewnida s (Lexi) Moustakas Space Telescope Science Institute M Dickinson, H Ferguson, M Giavalisco R Somerville, T Dahlen, B Mobasher, H Yan. ~3x10 10 M o. The SDSS z~0 age/stellar mass relation. age.

E N D
Massive Galaxies at high redshift GOODS http://www.stsci.edu/science/goods Lewnidas (Lexi) Moustakas Space Telescope Science Institute M Dickinson, H Ferguson, M Giavalisco R Somerville, T Dahlen, B Mobasher, H Yan
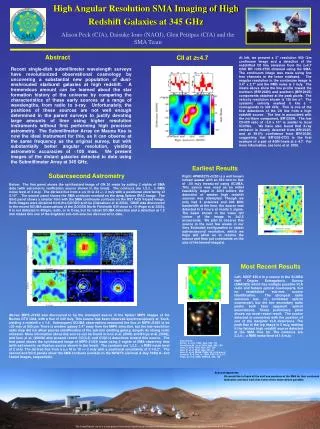
~3x10¹⁰ Mo The SDSS z~0 age/stellar mass relation age From Kauffmann et al. Kauffmann et al. 2002
outline • The public GOODS -- new: Spitzer! -- • identifying massive field galaxies at redshifts z>1 • color-selected samples & fitting SEDs EROs, IRAC-EROs, J-K-selection ... • Conclusions: 1. Galaxies with M>few x 1010Msun are abundant even at z~1, 2, 3 2. Spitzer's rest-frame IR observations are key • In progress: • Towards a complete census of masses and SFRs at all z's • Properties as function of local environment (always in the field)
galaxy formation:an observational goal • A major goal is to measure the distribution function of stellar mass and star formation rates over time and environment f(M, M/t, t, d) This encapsulates the assembly history via all modes -- quiescent star formation, starbursts, &c. • Enter GOODS
What is GOODS? • The -Great Observatories Origins Deep Survey- • An orchestration of deep observations of the HDFN and the CDFS regions (~ 300 square arcmin in total) with the most powerful telescopes over the widest wavelength range • 30 times larger solid angle than HDFN + HDFS • Based on large programs with Spitzer, HST, Chandra, Newton, VLT, and more. • All datasets and derived products are open to the public domain
GOODS Space HST Treasury (PI: M. Giavalisco) B, V, i, z (27.2, 27.5, 26.8, 26.7) Δθ = 0.05 arcsec, or ~0.3 kpc at 0.5<z<5 SIRTF/Spitzer Legacy (PI: M. Dickinson) 3.6, 4.5, 5.8, 8, 24 μm Chandra (archival): 0.5 to 8 KeV Δθ < 1 arcsec on axis XMM-Newton (archival) GOODS Ground ESO, (PI C. Cesarsky), CDFS Full spectroscopic coverage in CDFS Ancillary optical and near-IR imaging Keck, access through GOODS’ CoIs Deep spectroscopic coverage Subaru, access through GOODS’ CoI Large-area BVRI imaging NOAO support to Legacy & Treasury Very deep U-band imaging Gemini Optical spectroscopy, HDFN Near-IR spectroscopy, HDFS VLA, ultra deep HDFN (+Merlin, WSRT) JCMT + SCUBA sub-mm maps of HDFN A Synopsis of GOODS • hold • hold
GOODS-S imaging coverage VLT/ISAAC J & K coverage shown (ESO v1.0 public release, May 2004). ISAAC H-band covers roughly half that area. Chandra coverage shown is only over the best PSF region (6arcmin). Complete image covers the whole GOODS-S field.
10’ 4.5, 8.0 mm 16’.5 3.6, 5.8 mm 1st epoch Spitzer GOODS CDF-S IRAC images First epoch CDF-S IRAC data observed in February 2004: • 23.2 hours/position x 4 pointings • ~60% of field covered in each IRAC channel • ~20% of field has 4-channel overlap, including the HUDF Second epoch in August 2004 will complete CDF-S IRAC observations 5s point source sensitivity (shot noise only):
HUDF The Hubble Ultra Deep Field in GOODS-South BViz + JH z850~28 09 march '04 Beckwith et al. in prep
1.6 to 8 mm view of the Hubble Ultra Deep Field What IRAC sees: • Light from longer-lived, red stars that dominate the mass of galaxies, redshifted to IRAC wavelengths • Starlight and active galactic nuclei obscured by dust • Potentially capable of seeing extremely distant objects, z > 7, which are invisible to optical telescopes
Redward-marching CMDs Overall color distribution gets bluer at longer wavelengths. “ERO-like” objects get fainter and fewer, but are still seen out to H - 5.8 mm color, corresponding to zERO > 3 Some bright galaxies pop up strongly at 8mm; presumably PAH emission from low-z, brighter galaxies, or “unveiled” AGN.
the red sequence to z>1.4 Rest-frame color- magnitude diagrams, z~0.2 to z~1.8 These data are from GOODS & GEMS, for different sample selections. The pink are K-selected. Red circles are EROs. See how these glxs dominate the red sequence at z~1 etc! "extremely red galaxies" Somerville & Moustakas et al - in prep
most KAB<22 extremely red objects are old-star dominated early late irregular other See also: Yan & Thompson 2004; Smith et al 2004 Bell et al 2004 "EROs" Space density of early-type EROs is n~2x10⁻⁴ Mpc-3 Moustakas et al 2004, ApJL
typical (old) ERO SED • The spectral energy distributions of the early-type EROs basically demand large ages, T>2Gyr • This is true even if there is some 'frosting' of star formation in place at z~1 (c.f. the DEEP2 findings) • This example has a GOODS:FORS2 redshift, z=1.19 • The GOODS:FORS2 spectroscopy of ~80 EROs is being used for line-index diagnostics - Kuntschner et al, in prep Data An old-elliptical SED Moustakas et al in prep
Population synthesis fitting to observed SEDs of Lyman Break Galaxies at z~3 (inclusion of Spitzer data is forthcoming!). A large wavelength range is needed, especially to the rest-IR. the (dark) art of SED fitting Significant mass from older stellar population can be hidden by ongoing star formation, -> 'maximum M/L models' Papovich 2002; Dickinson et al 2003
IRAC-Extremely Red Objects • IRAC-selected with fn(3.6mm)/fn(z850) > 20 (AB color > 3.25) • Like (R-K)Vega > 5 “ERO” criterion, but shifted to redder bandpasses. • We may expect that this will select ERO-like galaxies at z > 1.5 to 2 • 17 objects in HUDF area after excluding ambiguous cases due to blending • 2 are undetected in ACS HUDF; others are detected (even in B435), but faint. z - m(3.4mm) vs redshift Haojing Yan et al 2004, ApJ submitted
ACS NICMOS ISAAC IRAC An “IERO” in the HUDF
SED fitting for IEROs Most IEROs are best-fit with unreddened 2-component stellar populations: • ~2.5 Gyr old stars • + secondary ~0.1 Gyr burst • zphot ~ 1.6 to 2.9 -Key result:- * In most IEROs, at z~2ish, OLD STARS are required. * Dust does not seem to be enough.
SEDs of the HUDF IEROs A few objects are poorly fit by old stellar models (e.g., with sharply rising flux to 8mm) Rest-frame K-band luminosities ~0.35 to 5 times present-day L*K for early-type galaxies, implying substantial stellar masses (~1010 - 1011 Msun) Number density is comparable to or greater than that of present-day galaxies with similar luminosities
Completing the census • K-band EROs at z~1-1.5 • 3.6mm IEROs at z~1.6-2.9 • K-band J-K selection -> z~2.5 • UV selected LBGs z~2.5-6 (and >6?) • In progress... collating all the galaxy populations found to z~2.5 (ish) • High-redshift teaser: stellar populations of galaxies at z~5.8
3.6mm 4.5mm 5.8mm 8.0mm z = 5.828 i-dropout in CDF-S Excellent PSF greatly improves sensitivity at 3.6 and 4.5 mm relative to proposal expectations. Many of the brighter z~5-6 galaxies are well-detected in channels 1+2. IRAC Ultradeep HDF-N observations (up to 100h exposure time) may yield detections in channels 3+4
Stellar population fitting for z=5.828 galaxy Typical LBG colors. Clear evidence for a Balmer break between K and 3.6mm. Otherwise blue SED (above & below break) suggests low reddening, but this is not well constrained. Stellar mass estimate ~1.5x10¹⁰ Msunwhich is slightly larger than typical for L* LBGs at z~3 4000 A break observed wavelength
Advertisement! A STScI mini-Workshopon massive galaxies27-29 September 2004
Conclusions • The rest-infrared data are important! • Multi-l SED-fitting good for subtleties • In the field, we find many massive galaxies (M*>few x1010Msun) out to high-z • The space densities are significant, n~10-4-10-3 Mpc-3, so important as model constraints (see RSS talk) • In progress: clustering/environment
3.6mm 4.5mm 5.8mm 8.0mm The near future Stand by for the GOODS *Ultradeep* IRAC observations -and- the 24mm MIPS data in both fields Eucaristw!
J-K color for z~2-3 selection threshold color J-K>1.37 (AB) J-K>2.3 (Vega) Recent application of this criterion & of photometric redshift: van Dokkum et al 2003; Franx et al 2003; Daddi et al 2004 Moustakas et al in prep
10s limit o = X-ray sources 3s limit o = X-ray sources jk - selection • The sample I use here is Ks-selected, restricted to SNRK>10 • There are formal J-band dropouts that are included • Total sample size: 131 galaxies, ~1 arcmin-2 • X-ray sources are tracked, so two samples explored • 'wx' - X-ray sources • 'nx' - remaining obj's Moustakas et al in prep
jk - LBG comparison • Perhaps half of the jk sample would be too faint for ground-based R (rest-UV) selection to work... • NOT too faint for z850 selection, though (eg from GOODS). z850<26 for all jk galaxies! • The surface densities are comparable, ~1 arcmin-2 • The UV colors are only somewhat red -- V-z~1mag C.f. Steidel et al 2004 for z~2ish work
Distribution of jk sources 134 arcmin2
HUDF The Hubble Ultra Deep Field in GOODS-South BViz + JH z850~28 09 march '04 Beckwith et al. in prep
jk - HUDF morphologies ~10'' x 8'', ACS z-band, 0.03''/pix Moustakas et al in prep
Spatial associations There is early evidence of strong spatial correlations (Daddi et al 2004) Our own w(q) & x(q) measurement is in prog. The visual associations are dramatic, and there is clearly strong correspondence with distinct X-ray sources Xray Xray ~1 arcmin across
jk - stellar masses • very early results show rest-frame colors suggest stellar masses quite comparable to EROs, ~1010Mo and higher • space densities may be comparable to EROs, as well • ages are less constrained, still -- stay tuned. -Possible implications- • EROs' progenitors were already fully in place upon formation? • Star formation rates must have been high and sustained earlier -Questions- • How do AGN (and environment) figure in this picture? • What are their star formation rates?
jk - X-ray sources • There are 19/131 X-ray sources = 15% of the sample. • Considering the X-ray sources, and a typical redshift of z~2.2, we constrain the photon index G and the in situ obscuring HI column, NH: • G~1.2 & NH~1.2x1022 cm-2 • Luminosity/object LX>1043 erg s-1 • Largely => OBSCURED AGN Constraining the photon index Moustakas, Bauer, Immler et al in prep
jk - X-ray stack results Counts distributions 80 'clean' objects used for this stack Moustakas, Bauer, Immler et al in prep
AGN vs Star Formation • The observed soft and hard fluxes imply a photon index of around G ~ 1.8. • The estimated rest-frame LX(2-8keV) ~ 1042 erg s-1 AGN If the obscuration is high, the hard-X-ray flux is absorbed, so the photon index G will be larger. The X-ray luminosity and G are consistent with Seyfert-level AGN activity. Optical spectroscopy (van Dokkum et al 2003, Daddi et al 2004) do reveal some AGN features in the z~2 galaxies. Large population of obscured AGN? Star Formation For a ~Salpeter IMF, and star formation rates somewhat above a few Msun/yr, there is a tight relation between SFR and LX, which arises from high-mass X-ray binaries and supernovae. SFRX ~ 100 Msun/yr [Grimm et al 2003] SFRUV ~ few Msun/yr [Kennicutt 1998] "Ultraluminous infrared galaxies"?
Comparison with UV-selected galaxies at z~2 • Adelberger et al 2004; Steidel et al 2004; Reddy & Steidel 2004 • The redshift ranges can be comparable • The rest-UV colors are similar • ~50% of jk galaxies would be missed by R-limit, but not by z-limit • The implied X-ray and (uncorrected) UV SFRr are comparable • The pure AGN fraction is similar; it may be higher for jk galaxies All of these points suggest that results from UV-selected surveys are somewhat incomplete; and that AGN may in fact be more adundant than indicated so far.
Questions & implications • We are missing at least some of the mass and star formation at z~2-3 • What is the relation of jk's with sub-mm bright z>2 ULIRGs? • There may be a significant amount of hidden AGN activity at earlier times.
J-K colors of SCUBA glxs • Many (most??) SCUBA sources are at <z>=2.4 (Chapman et al 2003) • The majority have IR counterparts & many have similar J-K colors (Frayer et al 2004) • The surface densities are comparable; but the Frayer sources are magnified by foreground cluster. our reddest jk our color cut our 10s limit Frayer et al 2004
A picture • It seems that even at <z>~2.2, the progenitors of massive galaxies are already in place. Are these galaxies freshly 'assembled'? Or did that happen much earlier, still? Why and how would 'monolithic' collapse happen? This is a major challenge... • Even so, a lot is happening at that time. There is a lot of obscured AGN activity, that may be tracing something else. Morphologies are quite varied. • I suspect we're missing even more from the picture at z~3-4, where we might see the 'pieces' of these most massive galalxies, fall into place.
Clustering evolution - theory • Press-Schechter theory gives the abundance and clustering strength of dark matter halos • Similar global galaxy properties may be (should be) connected to the dark matter somehow • This connection can be made neatly with the 'occupation function' Moustakas & Somerville 2002
dark matter halo masses "bias" comes from the clustering, which fixes the 'minimum' DM halo mass There can be many galaxies in each dark matter "halo", or none. The average behavior can be parametrized with the Halo Occupation Function, or Distribution (cf Wechsler's talk) N(M>Mmin) = (M/M1)a Mmin - threshold halo mass M1 - 'typical' mass a - mass function slope space density Moustakas & Somerville 2002
galaxies' dark matter halos • The occupation function parameters can be constrained through the measured clustering strength and the space density • Here we plot the results for z~0 ellipticals, z~1.2 EROs, and z~3 LBGs
clustering evolution • The simplest model hasa galaxies following the dark matter they're associated with -- 'galaxy conserving model' (Fry 1996) • See the behavior of populations with properties established at different redshifts. Do they 'connect'? correlation scale linear bias
glazebrook et al The "Gemini Deep Deep Survey", GDDS, stellar space density meas'mt. Comparison is to 'GALFORM' models, Granato, Baugh. Are hierarchical models then, dead?? Glazebrook et al. 2004 : comparison with low baryon-density models...