Download
1 / 20
200 likes | 268 Views
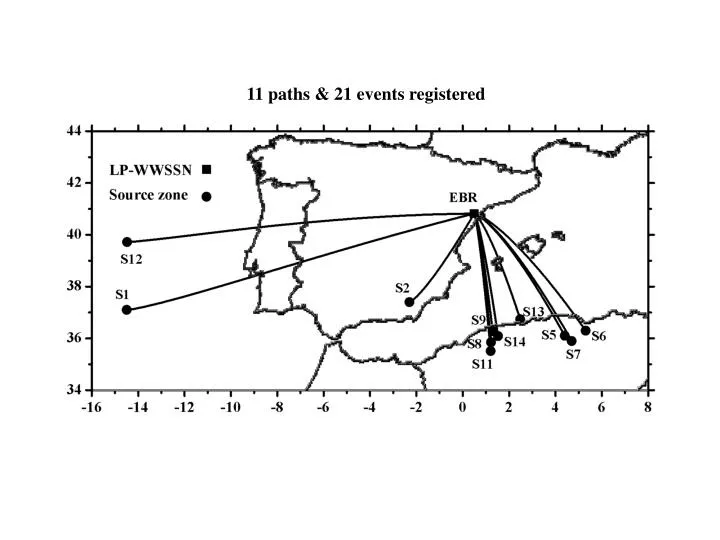
11 paths & 21 events registered. 11 paths & 15 events registered. 26 paths & 45 events registered. Instrumental Response.

E N D
Instrumental Response The problem arisen in the recording of a physical phenomena is well illustrated below. The instrument used to perform this record distorts the original true-signal x(t) given the output signal y(t). For this reason, a further process called deconvolution must be performed to recover the input signal x(t). Unfortunately, the input signal x(t) is never recovered completely. Thus, the signal recovered by the decondition filter is not exactly equal to x(t). Nevertheless, if the deconvolution process is well done, the recovered signal can be used instead of the original signal x(t), with a small error.
Convolution Formula F(w) = Ground spectrum ,, H(w) = Instrumental response
Instrumental correction (only amplitude considered)
Instrumental correction (only phase considered)
Instrumental correction (amplitude and phase considered)
Filtering process (MFT and TVF combined) Preprocessed signal (observed seismogram with instrumental correction) MFT Group velocity TVF Group velocity (final dispersion curve) Filtered signal MFT
MFT (Multiple Filter Technique) Seismic event nº 34 (registered at EBR station) (instrumental response corrected: amplitude and phase)
TVF (Time-Variable Filtering) Observed signal (preprocessed) TVF Obtained by MFT Filtered signal (time-variable filtered)
MFT application to the time-variable filtered signal (time-variable filtered)
Filtering process (comparison) Wave train contamination is removed Period range increased
Group velocity measurement for a path (average group velocity and standard deviation) Dispersion curves obtained after filtering process (MFT and TVF combined) applied to 3 events registered at EBR station. Average group velocity and standard deviation (vertical bars) obtained from the group velocity measurements showed above.
Forward Modeling (theoretical dispersion curve from a starting model)
Inversion process for a path (shear velocity structure from a dispersion curve) S5-EBR
References Cara M. (1973). Filtering dispersed wavetrains. Geophys. J. R. astr. Soc., 33, 65-80. Corchete V., Chourak M. and Hussein H. M., 2007. Shear wave velocity structure of the Sinai Peninsula from Rayleigh wave analysis. Surveys in Geophysics, 28, 299-324. Dziewonski A., Bloch S. and Landisman M. (1969). A technique for the analysis of transient seismic signals. Bulletin of the Seismological Society of America, 59, No. 1, 427-444.
CONTACT Prof. Dr. Víctor Corchete Department of Applied Physics Higher Polytechnic School - CITE II(A) UNIVERSITY OF ALMERIA 04120-ALMERIA. SPAIN FAX: + 34 950 015477 e-mail: corchete@ual.es