Download

1 / 28
280 likes | 430 Views
PERSPECTIVES OF THE TRADE CHINA-BRAZIL-USA: EVALUATION THROUGH A GRAVITY MODEL APPROACH. Sílvia H. G. de Miranda Vitor A. Ozaki Ricardo Fonseca Caio Mortatti ESALQ – University of Sao Paulo - Brazil 8- 9 th July 2007 IATRC Beijing Conference. Outline.

E N D
PERSPECTIVES OF THE TRADE CHINA-BRAZIL-USA: EVALUATION THROUGH A GRAVITY MODEL APPROACH Sílvia H. G. de Miranda Vitor A. Ozaki Ricardo Fonseca Caio Mortatti ESALQ – University of Sao Paulo - Brazil 8- 9th July 2007 IATRC Beijing Conference
Outline • Introduction: Brazilian-Chinese trade perfomance • The Gravity Model • Empirical Model: The Bayesian Inference • Results • Concluding remarks
1 - Introduction • Brazilian foreign trade: highly concentrated • 2004: 43% (EU and US) • 2005: 42.2% • China and Brazil informal trade since the creation of the Republic of China, in 1949. • In the 50’s: inexpressive flows (US$ 8 million) • Since 2002: the 3rd major importer from Brazil • 1999 to 2003: 15.4% of Brazilian exports • End of 2000: a bilateral agreement
Brazilian balance of trade (1984-2006) Source: ONU/COMTRADE (2007)
Chinese trade balance (US$ Billion FOB) Source: ONU/COMTRADE (2007)
Brazil-China bilateral trade balance – US$ FOB Source: ONU/COMTRADE (2007)
Composition of the Brazilian exports to the world Source: UN/COMTRADE (2007).
Most relevant categories of Brazilian products exported to China. 2006 Source: ONU/COMTRADE (2007)
Most relevant categories of Chinese products imported by Brazil. 2006 Source: ONU/COMTRADE (2007)
Objectives • To identify the relevant variables for the trade flow among Brazil and China • And the US • In the gravity model framework we consider the size, distance, cultural and political aspects and economical importance of these countries. • Bayesian Inference (Hierarchical model): Limited number of observations.
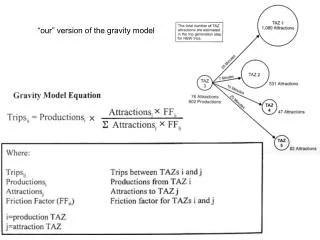
2 – The Gravity Model • Structural form – based on Dixon & Moon (1993) (1) Xijt = Exports from nation i to importer j at time t; Y = Economic size of exporter i and importer j; G = Geographical distance between two nations; R = Relative price index; D = Factors that stimulate or restrict trade between pairs of countries; and F = Political variable.
Functional Form • Taking logarithmic of equation (1) and including the autoregressive term, the deterministic trend and the latent variables (country-effect ζi and the Business Cycle effect ξt): (2) In which xijt=lnXijt, a=lnA, yit=lnYit, yjt=lnYjt, gij=lnGij, rit=lnRit , djt=lnDjt, fjt=lnFjt and uijt = lnεijt.
3 - Empirical Model: Bayesian Inference Approach • Ranjan and Tobias (2007) - modeling data through non-parametric Bayesian inference and specific country effects • Choice of the econometric method: • Limitations on the data set available - Short period of analysis • Only three countries • Panel data framework - a more detailed analysis (countries or regions)
The multivariate regression model yi = XiBi + εi (i = 1, 2, ... , m) (3) • y observations allocated in a txm matrix where • m variables • t observations. • Matrix Xi is composed of covariates t x k, • Bi = (β1, β2 , ... , βm) is a k x m matrix of the regression parameters, and • εi is a t x m matrix of non-observed random errors. • The dependence structure - Hierarchical models
Two important modelling features adopted • An univariate formulation for each i. yi ~ N(μi,τ) • In which τ is the precision parameter. • The prior distributions of B were modeled in a multivariate framework • we are modeling the mean structure, leaving precision constant throughout the analysis. μi ≡ E(yi) • The dependence structure - Hierarchical models
The prior distributions B ~ Nm(μ0, Λ0),p(B) |Λ0 |m/2 exp [–1/2 (B–μ0)´ Λ01 (B–μ0)] (4) τ~ G (ν, κ), p(τ) = (e-κ τ κ ν τ ν-1)/Γ(ν) (5) In which: ν = 10-3 κ =10-3
To the hiper-parameters of the prior distribution B were associated the following hiper-prioris: μ0 ~ Nm(μ1, Λ1),p(μ0) |Λ1 |m/2 exp [–1/2 (B–μ1)´ Λ1 (B–μ1)] (6) Λ0 ~ Wm(Θ, ψ), p(Λ0) = |Θ |ψ/2 |Λ0|( ψ –p–1)/2 exp [–1/2(tr(ΘΛ0))] (7)
Criteria for the models selection • Criteria for the models selection: Gelfand and Ghosh (1998): the “squared predictive error criteria” (SPE) • Objective: to minimize the posterior predictive loss.
Data set • 1962 - 2003 (basic gravity model - traditional variables) • 1995 - 2003 (relative price index, tariffs and political variables) • Sources: • World Development Indicators 2005 • United Nations Commodity Trade Statistics Database – COMTRADE (2007). • Maritime distances - Dataloy, 2007 • Tariffs (bound and applied rates): World Integrated Trade Solution (WITS); Comtrade, IDB/WTO • Political indicators: Transparency International (2007) - The corruption perception index (CPI);Heritage Foundation (2007) - Index of trade freedom and Freedom from corruption; number of trade agreements (U.S. Department of Commerce – USA and the Brazilian Ministry of External Relations.
Comparison of different gravity models - Brazil bilateral exports to China and US. Panel (cross-section/ time series). 1962-2003
Comparison of different gravity models - Brazil bilateral exports to China and US. Panel (cross-section/ time series). 1995-2003
Comparison of different gravity models with a basic specification for the United States bilateral exports to China and Brazil. Panel (cross-section/time series). 1962-2003
Comparison of different gravity models with a basic specification for the United States bilateral exports to China and Brazil. Panel (cross-section/ time series). 1995-2003
5 - Concluding Remarks • Even using the Bayesian Inference approach, the small amount of data seems to hinder the results; • Distance and the political effects had a poor performance (Cross-section variables). • Consistent results for the temporal variables: GDP; the Applied Weighted Average Tariffs (particularly significant for Brazilian exports)
Concluding remarks • Relative Prices: interesting results for the US but not for Brazil • Latent Variables – Business Cycle:better effects in the US case; • but if we include business cycle it seems to cause unexpected changes in other variables. • Cross-sectional Latent Variables: large and significant coefficients, systematicallyhigher for China.
Next steps • Other Relative Prices data set – Index for export prices • Transportation costs • Increase number of countries considered (the cross-section analysis) – for Economic Blocks and integration effects • Analyze the differentiated and homogeneous products
CEPEA – Center for Advanced Studies on Applied Economics/ESALQ- University of São Paulo -Brazil Sílvia Miranda: smiranda@esalq.usp.br Vitor Ozaki: vitorozaki@yahoo.com.br