Download
1 / 22
220 likes | 390 Views
Positioning agricultural vehicle safety in the context of all accidents involving large vehicles. Presented by Iain Knight HSE Agricultural vehicle workshop 15 th November 2007. Introduction . Overview of the safety priorities project Ranking of current casualty groups

E N D
Positioning agricultural vehicle safety in the context of all accidents involving large vehicles Presented by Iain Knight HSE Agricultural vehicle workshop 15th November 2007
Introduction • Overview of the safety priorities project • Ranking of current casualty groups • Characteristics of agricultural vehicle accidents
The priorities project • Large passenger, goods and agricultural vehicle safety - effectiveness of existing measures and ranking of future priorities in the UK • Funded by Department for Transport, TTS5 • Aims To determine how previous research and resulting measures have performed To identify and prioritise current issues To propose where best to target resources to deliver further worthwhile casualty savings
Light Commercial Vehicles LCV Goods vehicle≤3.5t* Agricultural Vehicles Other Motor Vehicles OMV * OMV excludes passenger cars * LCV excludes car derived vans Scope - Vehicles of interest (VOI) Heavy Goods Vehicles HGV Goods vehicle>3.5t Large Passenger Vehicles LPV Passenger vehicle>16 seats Minibuses Passenger vehicle 9-16 seats
Ranking of current casualty groups • Based on Stats 19 data from 2003-2005 inclusive • Derived 244 different casualty groups • Hierarchical levels used • Fatal serious and slight casualty numbers assigned to each group • Groups ranked by different means i.e. • Number of fatalities • Number of KSI • Number of all casualties • Casualty prevention value (£) of each of the above • Prevention value of KSI selected as most appropriate • Reflects 2010 casualty targets • Allows for differences in proportions fatally and seriously injured • Identifies which groups of casualties most important for meeting targets and allows preliminary assessment of scope of potential new measures but not effectiveness or cost-effectiveness
Casualty prevention values • Values used are standard DfT valuations (RCGB, 2005). • Based on “Willingness to Pay” methods representing: • Medical costs • Lost output (lost earnings plus non-wage payments by employer, NI etc) • Human costs i.e. an amount representing pain, grief and loss of enjoyment of life.
The most frequent casualty groups based on KSI prevention value (Annual Average) • *Subset of car occupants in impact with HGV (#1) • ** subset of LCV occupants (#3)
Ranking of casualty groups relating to agricultural vehicles • *Subset of car occupants in impact with agricultural (#47) • ** Subset of agricultural vehicle occupants (#69) • Agricultural vehicles of lower priority in terms of meeting casualty targets but cost effective measures may still be possible and desirable
UK Agricultural vehicle casualty trend • Serious and slight have decreased • Fatal remain approximately constant displaying random behaviour around an average of ~30 fatalities/year • Further trend analysis not possible due to lack of traffic data
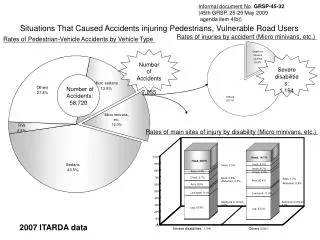
Most frequent impact configurations • Car occupant casualties in impact with Agricultural vehicle (average per year 2003-2005) • Front of car to rear of agricultural – 19 (28%) KSI casualties • Front of car to front of agricultural – 17 (25%) KSI casualties • Front of car to side of agricultural – 17 (25%) KSI casualties • Agricultural vehicle occupants (average per year 2003-2005) • Impact with other vehicle 15 (56%) KSI casualties, evenly distributed between cars and HGVs • Rollover 10 (38%) KSI casualties * • TWMV casualties in impact with Agricultural vehicle (average per year 2003-2005) • Front of TWMV to side of agricultural – 14 (46%) KSI casualties • 78% of these were impacts to the offside • Front of TWMV to front of agricultural – 7 (23%) KSI casualties
Skidding and jacknifing • Suggestion that tractor/trailer combinations over-represented in fatal accidents compared with tractor alone • Proportion of agricultural vehicles involving skidding and jacknifing (c.7%) lower than for HGVs (c.16%) • Traditional low speeds mitigate risk but speed capability increasing • ABS?
The HVCIS fatal accident sample • HVCIS sample of 29 fatal accidents involving agricultural vehicles from 1997 to 2002 • Similar distribution of casualty groups compared with STATS 19 but some smaller groups not represented in the sample
HVCIS – car occupant fatalities • 10 car occupant fatalities in 9 accidents • Driver behaviour • 3 of 9 (33.3%) agricultural vehicle drivers • Lack of attention • Error of judgement • Inexperience • 7 of 9 (77.8%) car drivers • Lack of attention • Error of judgement • 8 of 9* (88.9%) fatalities wearing seatbelts • * 1 where belt use unknown • 8 of 9 (88.9%) of accidents were on roads with a speed limit of 60 mile/hr or more
HVCIS – agricultural vehicle occupant fatalities • 5 agricultural vehicle occupant fatalities • 3 rollover accidents • 1 occupant ejected • 1 vehicle also in collision with an HGV • 3 of 5 fatalities ejected from cab • Seatbelt use known for 3 of 5 fatalities – all unbelted • Behaviour of 4 of the agricultural vehicle drivers was considered contributory to the cause of the accident
HVCIS – TWMV fatalities • 9 TWMV fatalities in 8 accidents • Manoeuvres • 7 of 9 (77.8%) where TWMV was overtaking moving vehicle or going ahead other and the Agricultural vehicle was turning right • Driver behaviour • 2 of 8 (25.0%) agricultural vehicle drivers • Lack of attention • Error of judgement • 7 of 8 (87.5%) TWMV riders • Error of judgement • Excess speed • Reckless/aggressive • 7 of 8 (87.5%) of accidents were on roads with a speed limit of 60 mile/hr or more
HVCIS - Vehicle Defects • 29 agricultural vehicles • 10 vehicles defective (c.40% of which were braking defects) (bottom left) • Low numbers but compares poorly with other vehicle types • Consistent with VOSA prohibition data (right)
Conclusions • Accidents involving agricultural vehicles are of much lower priority than accidents involving HGVs, LCVs and LPVs • Cost effective countermeasures still possible • Importance in UK comparable to EU average • When considering Agricultural vehicle safety: • Protecting car occupants (#47), TWMV users (#67) and agricultural vehicle occupants (#69) is most important. • Defects, particularly brakes, are important to all groups • Turning right is important, particularly for TWMV users • Rollover and seat-belt use are important for agricultural vehicle occupants • Braking may become a more important issue with increased speed, if higher speed tractors are permitted or result in reduced compliance with the existing speed limits. Improved standards may be implemented in EU regulation.
Positioning agricultural vehicle safety in the context of all accidents involving large vehicles Presented by Iain Knight Tel: +44 (0)1344770079 Email:iknight@trl.co.uk