Download
1 / 10
110 likes | 244 Views
PAW: Physicist Analysis Workstation. What is PAW? A tool to display and manipulate data. Learning PAW See ref. in your induction week notes. Running PAW: 2 Versions:- PAW: 2 windows: A terminal window for command input A graphics window for output PAW++ : GUI version

E N D
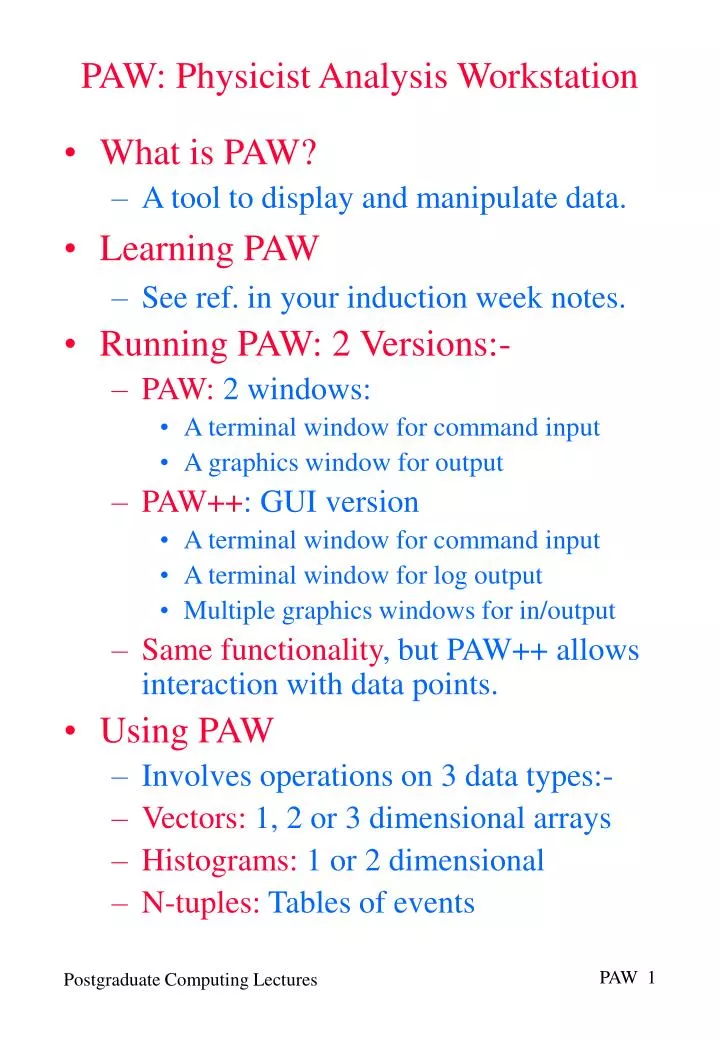
PAW: Physicist Analysis Workstation • What is PAW? • A tool to display and manipulate data. • Learning PAW • See ref. in your induction week notes. • Running PAW: 2 Versions:- • PAW: 2 windows: • A terminal window for command input • A graphics window for output • PAW++: GUI version • A terminal window for command input • A terminal window for log output • Multiple graphics windows for in/output • Same functionality, but PAW++ allows interaction with data points. • Using PAW • Involves operations on 3 data types:- • Vectors: 1, 2 or 3 dimensional arrays • Histograms: 1 or 2 dimensional • N-tuples: Tables of events
PAW: Data Flows Vector ASCII File PAW Histogram N-tuple HBOOK File External data flows but can also create internally • Multiple open at once • Organised into directories • Each directory can have multiple versions of same object (n-tuple or histogram) • Can duplicate and merge Main internal data flows (but all are possible)
PAW: Vectors • Vectors • Have character identifier e.g. vec • 1, 2 or 3 dim. arrays e.g. vec(10,3) • Arbitrary size and number (almost!) • Create in memory, Read from disk (can filter) and Write to disk • Combine e.g. • Select subrange e.g. vec(2:5,2) • Draw (as histogram bins), Plot (histogram points) and Fit to function a = b * c ~ ~ ~
PAW: Functions • Functions • Plot user or built-in functions • 1, 2 or 3dimensional • Wide range of representations (this is just a few of them!)
PAW: Histograms • Histograms • Have a numeric identifier e.g. 123 • 1 or 2 dimensional • Can associate errors with bins • Read from / Write to disk / Create in memory. • Combine e.g. A = B * C • Select subrange e.g.123(1:20) • Wide range of plotting and fitting facilities
PAW: N-tuples • N-tuples • Have numeric identifiers e.g. 123 • Record a set of n numbered (1..n) events each with m named attributes:- • Two types • Row-Wise • Stored as a set of rows • Each attribute is a 4-byte floating point • Column-Wise • Stored as a set of attributes • Attributes can be a integer, real or char • Fixed or variable length • Create in memory, I/O to disk. • Merge two or more. ******************************************************** * NTUPLE ID= 10 ENTRIES= 3354 CERN Population * ******************************************************** * Var numb * Name * Lower * Upper * ******************************************************** * 1 * CATEGORY * 0.102000E+03 * 0.567000E+03 * * 2 * DIVISION * 0.100000E+01 * 0.130000E+02 * * 3 * FLAG * 0.000000E+00 * 0.310000E+02 * * 4 * AGE * 0.210000E+02 * 0.640000E+02 * * 5 * SERVICE * 0.000000E+00 * 0.350000E+02 * ********************************************************
PAW: N-tuples (cont) • Can plot functions of attributes, e.g. if have attributes x,y plot:- sqrt(x**2+y**2) • Can apply cuts on points to plot e.g.:-sin(x)+log(y) z>1.0.and.z<10.0This is very powerful! • Can also Print rows on basis of cuts • Masks:- • Used to store commonly used cuts • Saves time: only computed once • Can have 32 masks per n-tuple • Can plot in 1, 2 or 3 dimensions, e.g. z%y%x to plot Z v. Y v. X • Plotting, PAW generates histograms:- • Automatically choosing suitable scales • For fine control can define histogram and the plot into that. • Scanning: Each entry in n-tuple is processed by user code
PAW: Programming • SIGMA • A system for vector operation e.g:-sigma x=array(200,0#2*pi)sigma s=sin(x) • Create a 200 point vector x running 0 .. 2 • Create a 200 point vector s of sin(x) • COMIS • A FORTRAN interpreter • Supports a subset of FORTRAN77 • Has access to PAW’s internal data structures • Can make calls to a wide range of CERNlib routines • Allows users to add their own code, without linking, for:- • N-tuple plotting and cutting functions • Fitting and plotting functions • Non-standard operations on internal data structures.Another very powerful feature!
PAW: Command Interface • Commands • Have a tree structure e.g. vector/operations/vscale • Can abbreviate if unambiguous e.g.ve/op/vsc or even vsc • Case insensitive • Built-in help: summary (usage) or detailed (help) • Command line recall with arrow keys • Can be stored in files as macros. Files have the extension .kumac • Complete programming language with:- • Local variables • Global variables • Flow control • Argument passing - so that macros can be used like subroutines • Embedded data files • Typically users develop kumac files as part of their analysis tool set
PAW: Graphics • Options to Control Appearance • Position on screen. Direct plots into tiled zones on the screen • Log and linear scales • Titles • Attributes of graphical elements:- • Colour • Thickness • Character font • Line type (solid or broken) • HIGZ • Is the underlying plotting package • Has a wide range of primitives e.g. titles, axes, polylines etc. that can supplement raw plots • All graphical output can be stored in files and output as Postscript.