Download
1 / 29
310 likes | 529 Views
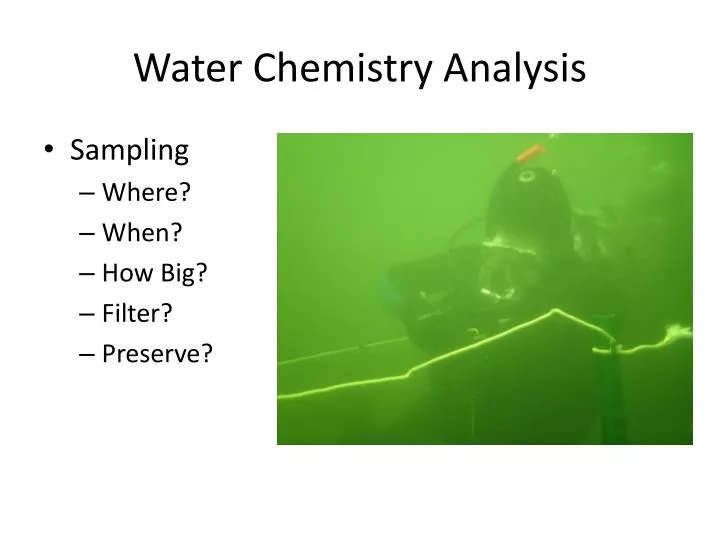
Water Chemistry Analysis. Sampling Where? When? How Big? Filter? Preserve?. Analysis Techniques. Electrochemical Spectroscopic Chromatographic. How do these ‘probe’ different properties?. Electrochemistry.

E N D
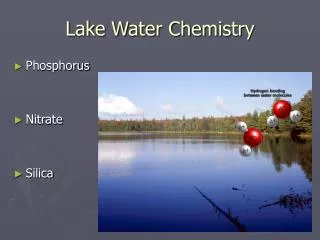
Water Chemistry Analysis • Sampling • Where? • When? • How Big? • Filter? • Preserve?
Analysis Techniques • Electrochemical • Spectroscopic • Chromatographic How do these ‘probe’ different properties?
Electrochemistry • Common techniques: pH, conductivity, Ion-specific electrodes, amperometry, voltammetry • Utilize electrical properties of analyteto determine concentrations
Electrodes • The parts of a cell that are the sites of anodic and cathodic reactions • Working and counter electrodes - conductive materials where the redox reactions occur • Most cells also use a reference electrode recall that all Energy is relative to a predetermined value, the reference electrode provides an ‘anchor’ for the system • The electrical measuring device measures a property of the electrodes in a solution
Pathway of a general electrode reaction Interface - electrode surface region bulk electrode
Constant current Constant electrode potential coulometry Q = i dt Controlled potential Electroanalytical methods Interfacial methods bulk methods dynamic methods i > 0 Static methods i=0 Conductometry G=1/R Conductometric titrations Potentiometric titrations volume potentiometry E Coulometric titrations Q=it Amperometric titrations volume Electrogravimetry (wt) Electrogravimetry (wt) Voltammetry I=f(E)
Potentiometry • Measurement of potential in absence of applied currents • Depends on galvanic cells – no forced reactions by applying external potential Ecell=Eindicator-Ereference+Ejunction • Reference electrodes are a potentiometric application that stays at a defined (Nernst), constant, and steady potential • Calomel Hg/Hg2Cl2(sat’d),KCl(x M)║ • Ag/AgCl Ag/AgCl(sat’d), KCl (x M) ║
pH = - log {H+}; glass membrane electrode H+ gradient across the glass; Na+ is the charge carrier at the internal dry part of the membrane soln glass soln glass H+ + Na+Gl- Na+ + H+Gl- pH electrode has different H+ activity than the solution E1 E2 SCE // {H+}= a1/ glass membrane/ {H+}= a2, [Cl-] = 0.1 M, AgCl (sat’d) / Ag ref#1 // external analyte solution / Eb=E1-E2 / ref#2
pH elecctrodeglass • Corning 015 is 22% Na2O, 6% CaO, 72% SiO2 • Glass must be hygroscopic – hydration of the glass is critical for pH function • The glass surface is predominantly H+Gl- (H+ on the glass) and the internal charge is carried by Na+ E1 E2 glass H+Gl- H+Gl- Na+Gl- H+Gl- H+Gl- Reference solution Analyte solution H+Gl- H+Gl- Na+Gl- H+Gl- H+Gl-
pH = - log {H+} K = reference and junction potentials Values of NIST primary-standard pH solutions from 0 to 60 oC
Ion Specific Electrodes (ISE’s) • Most utilize a membrane which selects for specific ion(s) – H+, Ca2+, K+, S2-, F-, etc. • This is done through either ion exchange, crystallization, or complexation of the analyte with the electrode surface • Instead of measuring the potential of the galvanic cell, this relates more to a type of junction potential due to separation of an ion
Electrochemistry - electron transfer reactions 1) Chemical Reactions 4 Fe2+ + O2 + 4 H+ 4 Fe3+ + 2 H2O 2) Electrochemical cells - composed of oxidation and reduction half reactions Fe2+ Fe3+ + e- ANODIC O2 + 4 H+ + 4 e- 2 H2O CATHODIC a) Galvanic (Voltaic) cell - thermodynamically favorable or spontaneous (G < 0) e.g., batteries, pH and ion selective electrode (ISE) measurements b) Electrolytic cell - non-spontaneous or thermodynamically unfavorable reactions (G > 0) are made to occur with batteries (EAPPL = E applied) e.g., electrolysis, electroplating, voltammetry
Electrolytic Cell • Forcing a redox reaction to go in a particular direction by APPLYING the energy required to go forward APPLIED Potential! Reaction would not normally go in water Fe2+ + 2e- Fe0
Environmental Voltammetry • Apply a potential and measure a current response (a half-reaction, involving an e-) • Specific species react at/with the electrode surface AT a specific potential • That potential is from either the equilibrium of a half reaction or a kinetic effect where reaction requires some extra energy to proceed (called overpotential)
Reference Electrode –Ag/AgCl ‘anchors’ V Counter Electrode Working Electrode Potentiostat Reference Electrode Counter Electrode – Pt, facilitates e- flow Working Electrode – Au(Hg) amalgam, surface where specific reactions occur Three Electrode System
V V time time V time Cyclic Voltammetry ‘Normal’ S-shape curve or peak (due to other processes) Stripping Voltammetry Initial ‘plating’ reaction: Hg + HS- HgS + H+ + 2 e- For x seconds followed by reaction HgS + 2e-+ H+ Hg + HS- Square-Wave Voltammetry Forward reaction followed by back reaction with V drop voltammogram dependent on ‘pulse’ height
sample Transmittance spectroscopy Reflected spectroscopy Raman Spectroscopy Spectroscopy • Exactly how energy is absorbed and reflected, transmitted, or refracted changes the info and is determined by different techniques
Light Source • Light shining on a sample can come from different places (in lab from a light, on a plane from a laser array, or from earth shining on Mars from a big laser) • Can ‘tune’ these to any wavelength or range of wavelengths IR image of Mars Olivine is purple
Spectroscopy • Beer’s Law: A = e l c • Where Absorbance, A, is equal to the product of the path length, concentration, c, and molar absorptivity, e
Causes of Absorption • Molecular or atomic orbitals absorb light, kicks e- from stable to excited state • Charge transfer or radiation (color centers) • Vibrational processes – a bond vibrates at a specific frequency only specific bonds can do absorb IR though (IR active)
Emission Spectroscopy • Measurement of the energy emitted upon relaxation of an excited state to a lower state (can be the ground state) • How to generate an excitation – shoot it with high energy particles – UV, X-rays, or heat it in flame or plasma
Inductively Coupled Plasma • Introduction of molecules in a plasma creates excitations and emits light in the UV and Visible ranges that correspond to elements • Plasma is 7000 degrees – molecules get broken up, the individual elements create the light emission
Raman Spectroscopy • Another kind of spectroscopy which looks at a scattering effect and what that tells us about the chemistry, oxidation state, and relative proportions of different ions
Nuclear Magnetic Resonance Spectroscopy (NMR) • NMR is useful for determining short-range cation ordering in minerals. • The NMR spectrometer can be tuned to examine the nucleus of mineralogical interest (e.g. aluminosilicates (27Al, 29Si, 23Na), oxides (17O, 25Mg, etc.), phosphates (31P), hydrous minerals (1H, 19F)). • NMR is particularly useful for cations that can not be distinguished by X-ray methods, such as Si/Al ordering in aluminosilicates
XANES and EXAFS • X-ray adsorption near-edge spectroscopy and Extended X-ray adsorption Fine Structure, commonly done with synchrotron radiation because the higher energy X-ray yields more precise data • X-ray techniques which look at the fine details of X-ray interactions with minerals • Sensitive to oxidation states and specific bonding environments
Chromatography • Analyte separation as it moves through a material followed by analysis (spectroscopic or electrochemical)
Separation • Interaction of analyte with stationary phase based on charge density, hydrophobicity, or size • Analyte displaced across stationary phase by an eluent • Eluent can be ionic (HCO3-), organic (Methanol), gas (Helium)
chromatograph • Peak separation a function of analyte, stationary phase, eluent composition and flow rate • Goal is to maximize peak separation