Download
1 / 14
140 likes | 293 Views
The nitrogen dioxide sonde. See: Sluis et al., AMT, 2010. W.W. Sluis , M.A.F. Allaart, A.J.M. Piters, L.F.L. Gast. Content list. Why an NO 2 sonde? Characteristics Design of the instrument The detector The luminol solution Calibration Profiles Future development. Why an NO 2 sonde?.

E N D
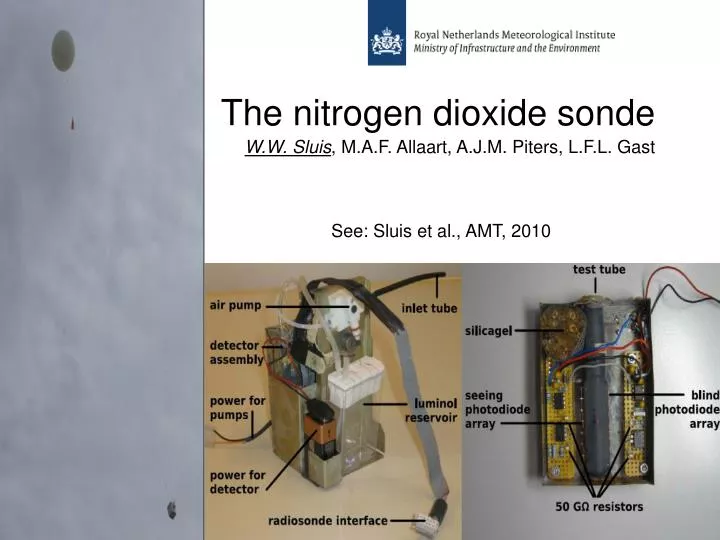
The nitrogen dioxide sonde See: Sluis et al., AMT, 2010 W.W. Sluis, M.A.F. Allaart, A.J.M. Piters, L.F.L. Gast
Content list • Why an NO2 sonde? • Characteristics • Design of the instrument • The detector • The luminol solution • Calibration • Profiles • Future development
Why an NO2 sonde? • Air quality monitoring with high vertical resolution. • Satellite and AQ-model validation. • Alternative to scattered light measurements. • Can be applied in an operational network. http://www.temis.nl/airpollution/no2.html
Characteristics • Measurement range 1 – 100 ppbv. • Fast (1 second) • Light weight (0.7 kg) • Little power • Cheap (disposable) • Not dangerous to finder / environment
The detector The circuit has been designed to convert femtoamperes from the photodiodes to millivolts at the output. From left to right:8 photodiodes Current to voltage converter a low-pass RC filter, with time constant = 1 sec. A times 1 amplifier, to reduce the output impedance.
The luminol solution (1/2) • Luminol: The active compound reacts with NO2. • Potassium hydroxide: To solve luminol in water. First step of the reaction. • Sodium sulfite: Removes ozone, sulfur dioxide, and PAN interference. • Ethanol: Increases the light signal. • Sodium EDTA: In combination with Triton X-100, it increases the function of sodium sulfite. • Triton X-100: Lowers the surface tension of water, thereby enhancing the contact surface between air and liquid. • Oxygen
The luminol solution (2/2) The chemicals are optimized with respect to the light signal.This is done with an iterative process by varying the concentration of one component while holding the concentrations of all the other compounds constant at their optimum values, as found in a previous iteration step.
Calibration Applied corrections sonde data: • Acidification of the luminol solution. The sonde can measure for 2.5 – 3 hours (pH course 12.5 – 11.6). Signal variation approximately 10%. • The temperature dependence of the luminol solution is 3% per degree Celsius. • Temperature dependence of the dark current of the detector. • Sensitivity of the luminol solution appears to increase with age (still under investigation). Need for absolute calibration before each launch.
Comparison of the NO2 sonde with an in-situ monitor Special thanks to Lou Gast, RIVM
Future development • Investigating the effect of different treatment of the solution. • Finding the best procedure for absolute calibration. • Making the signal reproducible within about 10%. • Better characterization of the sensor at low pressure, e.g. pump efficiency. • Investigating possible impact of other atmospheric compounds. • Starting cooperation with GRAW radiosondes (Germany) for possible future production.