Download
1 / 18
180 likes | 332 Views
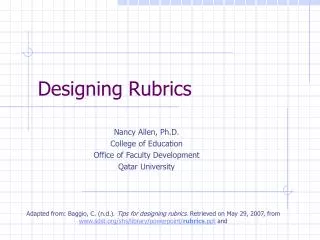
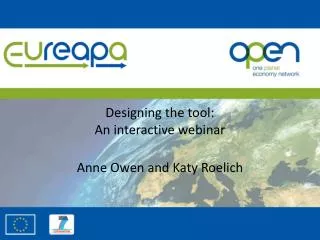
Designing the tool: An interactive webinar. Anne Owen and Katy Roelich. Aims of the webinar and questionnaire. To steer the look, feel and functionality of the tool To identify our user group To understand the unique needs of different user types (user profiling)

E N D
Designing the tool:An interactive webinar Anne Owen and Katy Roelich
Aims of the webinar and questionnaire • To steer the look, feel and functionality of the tool • To identify our user group • To understand the unique needs of different user types (user profiling) • To start to form the EUREAPA user group
Webinar method • Three questions to be answered during the webinar • Interactive show of hands • Use the comment area to discuss finer points • What level of data do you want to have access to? • Where should the tool be held? • What additional features would you like to aid data interpretation? • After the webinar has finished, please fill in the questionnaire to provide more detail
Watermelon or a fruit salad Data • Env accounts • MRIO EUREAPA engine Water footprint by country for years 1992-2006 Ecological footprint for all consumer items for Greece in 2006 CO2 emissions of clothing by country for 2006 • Uni-dimentional data base • Able to extract all the data • Limited interpretation
Watermelon or a fruit salad Querying tool • Env accounts • MRIO EUREAPA engine • Pre determined data taken from the engine • Limited number of ‘slices’ • Interesting angles interpreted with graphics
Watermelon or a fruit salad: making changes to the tool • Env accounts • MRIO EUREAPA engine • A new csv input file replacing certain fields with results from: • a preloaded scenario • user updated baseline data • user defined scenario of the future New set of results
Watermelon or a fruit salad: making changes to the tool • Env accounts • MRIO EUREAPA engine A new csv input file replacing certain fields • Sliders and dials: • preset to preloaded scenario • user defined Changes viewed in tool results
Vote now! • Raise your hand if you want the whole watermelon
Vote now! • Raise your hand if you want the tool on the web
Making comparisons, benchmarking and explaining the data How does my footprint compare to other countries? How close are we to one planet living? What factors may lead to a higher impact Does having a higher impact influence wellbeing?
View Data Manipulating data Choose Area EU27 Austria Belgium Bulgaria Cyprus Czech Republic Denmark Single area focus Spatial Compare Chart Compare Scatterplots Water Footprint of Food 200 litres per person Choose Category Total Housing Transport Food Consumables Services Other 50 litres per person Choose Time All 2000 2001 2002 2003 2004 2005 2006 2007 2008 Choose unit Total Per person
View Data Manipulating data Choose Area EU27 Austria Belgium Bulgaria Cyprus Czech Republic Denmark Single area focus Spatial Compare Chart Compare Scatterplots Water Footprint of Food Choose Category Total Housing Transport Food Consumables Services Other Choose Time All 2000 2001 2002 2003 2004 2005 2006 2007 2008 Choose unit Total Per person
Targets and benchmarks High Highest in EU 27 Highest historically Highest consumption category My area’s carbon footprint of catered food Lowest historically Target? Lowest in EU 27 Low Lowest consumption category
Making comparisons Gap minder example
Vote now! • Raise your hand if you want additional information in the tool to aid interpretation