Download
1 / 74
800 likes | 1.02k Views
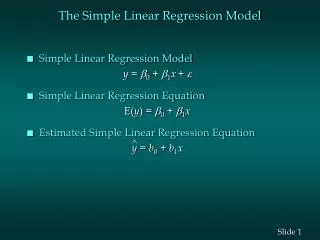
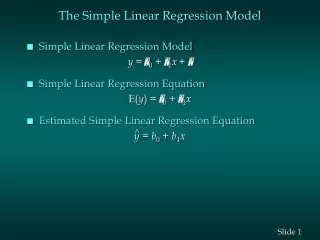
SIMPLE REGRESSION MODEL. The nature of the relationship between variables can take many forms, ranging from simple mathematical functions to extremely complicated ones. The simplest relationship consists of a straight-line or linear relationship (linear function).

E N D
The nature of the relationship between variables can take many forms, ranging from simple mathematical functions to extremely complicated ones. The simplest relationship consists of a straight-line or linear relationship (linear function). This is an example plot of linear function:
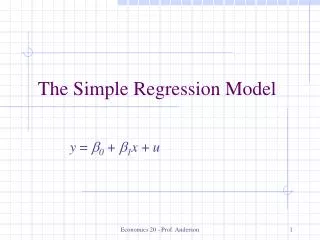
SIMPLE REGRESSION MODEL X3 X X1 X2 X4 Y b0 Suppose that a variable Y is a linear function of another variable X, with unknown parameters b0 and b1 that we wish to estimate. Suppose that we have a sample of 4 observations with X values as shown. 1
SIMPLE REGRESSION MODEL X3 X X1 X2 X4 Y Q4 Q3 Q2 Q1 b0 If the relationship were an exact one, the observations would lie on a straight line and we would have no trouble obtaining accurate estimates of b0 and b1. When all empirical pairs of X-Y points lie on a straight line – it is called a functional or deterministic relationship. 3
SIMPLE REGRESSION MODEL X3 X X1 X2 X4 P4 Y Q4 P1 Q3 Q2 Q1 P3 b0 P2 In practice, most economic relationships are not exact and the actual values of Y are different from those corresponding to the straight line. 4
SIMPLE REGRESSION MODEL X3 X X1 X2 X4 P4 Y Q4 P1 Q3 Q2 Q1 P3 b0 P2 To allow for such divergences, we will write the model as Y = b0 + b1X + e, where e is a disturbance term. 5
SIMPLE REGRESSION MODEL X3 X X1 X2 X4 P4 Y Q4 P1 e1 Q3 Q2 Q1 P3 b0 P2 Each value of Y thus has a nonrandom component, b0 + b1X, and a random component, e. The first observation has been decomposed into these two components. 6
SIMPLE REGRESSION MODEL X3 X X1 X2 X4 P4 Y P1 P3 P2 In practice we can see only the P points. 7
SIMPLE REGRESSION MODEL X3 X X1 X2 X4 P4 Y P1 P3 P2 b0 Obviously, we can use the P points to draw a line which is an approximation to the line Y = b0 + b1X. If we write this line Y = b0 + b1X, b0 is an estimate of b0 and b1 is an estimate of b1. ^ 8
SIMPLE REGRESSION MODEL However, we have obtained data from only a random sample of the population. For a sample, b0and b1 can be used as estimates (estimators) of the respective population parameters β0 and β1 The intercept b0 and the slope b1 are the coefficients of the regression line. The slope b1 is the change in Y (increase, if >0, and decrease, if <0) associated with a unit change in X. The intercept is the value of Y when X=0; it’s the point at which the population regression line intersects the Y axis. In some cases the intercept has no real-world meaning (for example when X is the class size, Y is the test score – the intercept is the predicted value of test scores when there are no students in the class!). Random error contains all the other factors besides X that determine the value of the dependent variable Y, for a specific observation.
SIMPLE REGRESSION MODEL X3 X X1 X2 X4 Y (actual value) P4 (fitted value) Y R3 R4 R2 P1 R1 P3 P2 b0 The line is called the fitted model and the values of Y predicted by it are called the fitted values of Y. They are given by the heights of the R points. 9
SIMPLE REGRESSION MODEL X3 X X1 X2 X4 Y (actual value) P4 (fitted value) Y e4 (residual) R3 R4 R2 P1 e1 e3 e2 R1 P3 P2 b0 The discrepancies between the actual and fitted values of Y are known as the residuals. 10
SIMPLE REGRESSION MODEL Least squares criterion: Minimize SSE (residual sum of squares), where To begin with, we will draw the fitted line so as to minimize the sum of the squares of the residuals, SSE. This is described as the least squares criterion. 19
SIMPLE REGRESSION MODEL Least squares criterion: Minimize SSE (residual sum of squares), where Why not minimize Why the squares of the residuals? Why not just minimize the sum of the residuals? 20
SIMPLE REGRESSION MODEL Y X3 X X1 X2 X4 P4 Y P1 P3 P2 The answer is that you would get an apparently perfect fit by drawing a horizontal line through the mean value of Y. The sum of the residuals would be zero. 21
Y X3 X X1 X2 X4 SIMPLE REGRESSION MODEL P4 Y P1 P3 P2 You must prevent negative residuals from cancelling positive ones, and one way to do this is to use the squares of the residuals. 22
SIMPLE REGRESSION MODEL Since we are minimizing which has two unknowns, b0 and b1. A mathematical technique which determines the values of b0 and b1 that best fit the observed data is known as the Ordinary Least Squares method (OLS). Ordinary Least Squares is a procedure that selects the best fit line given a set of data points, by minimizing the sum of the squared deviations of the points from a line. That is, if is the equation of the best line to fit through the data then in order to get this best line, using the least squares criteria, for each value data point (xi,yi) if where , theneiis the amount of deviation of the data point from the line. The least squares criteria minimizes, finds the slope b1 and the y-intercept b0 from the data, that minimizes the sum of the square deviations,.
SIMPLE REGRESSION MODEL For the mathematically curious , I provide a condensed derivation of the coefficients. To minimize determine the partial derivatives with respect to b0 and with respect to b1. These are: Setting and solving for b0 and b1 results in equations given below.
SIMPLE REGRESSION MODEL Since there are two equations with two unknown, we can solve these equations simultaneously for b0 and b1 as follows: ONLY FOR REGRESSION MODELS WITH ONE INDEPENDENT VARIABLE! We also note that the regression line always goes through the mean ( ).
SIMPLE REGRESSION MODEL In matrix notation OLS may be written as: Y = Xb + e The normal equations in matrix form are now XT Y = XTXb And when we solve it for b we get: b = (XTX)-1XTY where Y is a column vector of the Y values and X is a matrix containing a column of ones (to pick up the intercept) followed by a column of the X variable containing the observations on it and b is a vector containing the estimators of regression parameters.
SIMPLE REGRESSION MODEL We can state as follows: How to inverse XTX? 1.matrix determinant 2.minor matrix 3.cofactor matrix 4.inverse matrix
SIMPLE REGRESSION MODEL X 22 26 45 37 28 50 56 34 60 40 Y 16 17 26 24 22 21 32 18 30 20 EXAMPLE In this problem we were looking at the way home size is effected by the family income. We will use this model to try to predict the value of the dependent variable based on the independent variable. Also, the slope will help us to understand how the Y variable changes for each unit change in the X variable. Assume a real-estate developer is interested in determining the relationship between family income (X, in thousand of dollars) of the local resident and the square footage of their homes (Y, in hundreds of square feet). A random sample of ten families is obtained with the following results:
Let’s try another example: X – commercial time (minutes) Y – sales ($ hundred thousand)
MULTIPLE REGRESSION WITH TWO EXPLANATORY VARIABLES Y = b0+ b1X1 + b2X2 + ei This sequence provides a geometrical interpretation of a multiple regression model with two explanatory variables. Y– weekly salary ($) X1 – length of employment (in months) X2 – age (in years) b0 Y X2 X1 Specifically, we will look at weekly salary function model where weekly salary, Y, depend on length of employment X1, and age, X2. 1
MULTIPLE REGRESSION WITH TWO EXPLANATORY VARIABLES Y = b0+ b1X1 + b2X2 + ei Y– weekly salary ($) X1 – length of employment (in months) X2 – age (in years) b0 Y X2 X1 The model has three dimensions, one each for Y, X1, and X2. The starting point for investigating the determination of Y is the intercept, b0. 3
MULTIPLE REGRESSION WITH TWO EXPLANATORY VARIABLES Y = b0+ b1X1 + b2X2 + ei Y– weekly salary ($) X1 – length of employment (in months) X2 – age (in years) b0 Y X2 X1 Literally the intercept gives weekly salary for those respondents who have no age (??)and no length of employment (??). Hence a literal interpretation of b0 would be unwise. 4
MULTIPLE REGRESSION WITH TWO EXPLANATORY VARIABLES Y = b0+ b1X1 + b2X2 + ei Y– weekly salary ($) X1 – length of employment (in months) X2 – age (in years) pure X1 effect b0+ b1X1 b0 Y X2 X1 The next term on the right side of the equation gives the effect of X1. A one month of employment increase in X1 causes weekly salary to increase by b1dollars, holding X2 constant. 5
MULTIPLE REGRESSION WITH TWO EXPLANATORY VARIABLES Y = b0+ b1X1 + b2X2 + ei b0+ b2X2 pure X2 effect b0 Y X2 X1 Similarly, the third term gives the effect of variations in X2. A one year of age increase in X2 causes weekly salary to increase by b2 dollars, holding X1 constant. 6
MULTIPLE REGRESSION WITH TWO EXPLANATORY VARIABLES Y = b0+ b1X1 + b2X2 + ei b0+ b1X1 + b2X2 combined effect of X1 and X2 b0+ b2X2 pure X2 effect pure X1 effect b0+ b1X1 b0 Y X2 X1 Different combinations of X1 and X2 give rise to values of weekly salary which lie on the plane shown in the diagram, defined by the equation Y = b0 + b1X1 + b2X2. This is the nonrandom component of the model. 7
MULTIPLE REGRESSION WITH TWO EXPLANATORY VARIABLES Y = b0+ b1X1 + b2X2 + ei b0+ b1X1 + b2X2+ ei e b0+ b1X1 + b2X2 combined effect of X1 and X2 b0+ b2X2 pure X2 effect pure X1 effect b0+ b1X1 b0 Y X2 X1 The final element of the model is the errorterm, e. This causes the actual values of Y to deviate from the plane. In this observation, e happens to have a positive value. 8
MULTIPLE REGRESSION WITH TWO EXPLANATORY VARIABLES Y = b0+ b1X1 + b2X2 + ei b0+ b1X1 + b2X2 + e e b0+ b1X1+ b2X2 combined effect of X1 and X2 b0+ b2X2 pure X2 effect pure X1 effect b0+ b1X1 b0 Y X2 X1 A sample consists of a number of observations generated in this way. Note that the interpretation of the model does not depend on whether X1 and X2 are correlated or not. 9
MULTIPLE REGRESSION WITH TWO EXPLANATORY VARIABLES Y = b0+ b1X1 + b2X2 + ei b0+ b1X1 + b2X2+ e e b0+ b1X1+ b2X2 b0+ b2X2 combined effect of X1 and X2 pure X2 effect pure X1 effect b0+ b1X1 b0 Y X2 X1 However we do assume that the effects of X1 and X2on salary are additive. The impact of a difference in X1 on salary is not affected by the value of X2, or vice versa. 10
MULTIPLE REGRESSION WITH TWO EXPLANATORY VARIABLES Slope coefficients are interpreted as partial slope/partial regression coefficients: • b1 = average change in Y associated with a unit change in X1, with the other independent variables held constant (all else equal); • b2 = average change in Y associated with a unit change in X2, with the other independent variables held constant (all else equal).
MULTIPLE REGRESSION WITH TWO EXPLANATORY VARIABLES The regression coefficients are derived using the same least squares principle used in simple regression analysis. The fitted value of Y in observation i depends on our choice of b0, b1, and b2. 11
MULTIPLE REGRESSION WITH TWO EXPLANATORY VARIABLES The residual ei in observation i is the difference between the actual and fitted values of Y. 12
MULTIPLE REGRESSION WITH TWO EXPLANATORY VARIABLES We define SSE, the sum of the squares of the residuals, and choose b0, b1, and b2so as to minimize it. 13
MULTIPLE REGRESSION WITH TWO EXPLANATORY VARIABLES First we expand SSE as shown, and then we use the first order conditions for minimizing it. 14
MULTIPLE REGRESSION WITH TWO EXPLANATORY VARIABLES We thus obtain three equations in three unknowns. Solving for b0, b1, and b2, we obtain the expressions shown above. 15
MULTIPLE REGRESSION WITH TWO EXPLANATORY VARIABLES The expression for b0 is a straightforward extension of the expression for it in simple regression analysis. 16
MULTIPLE REGRESSION WITH TWO EXPLANATORY VARIABLES However, the expressions for the slope coefficients are considerably more complex than that for the slope coefficient in simple regression analysis. 17
MULTIPLE REGRESSION WITH TWO EXPLANATORY VARIABLES For the general case when there are many explanatory variables, ordinary algebra is inadequate. It is necessary to switch to matrix algebra. 18
MULTIPLE REGRESSION WITH TWO EXPLANATORY VARIABLES In matrix notation OLS may be written as: Y = Xb + e The normal equations in matrix form are now XT Y = XTXb And when we solve it for b we get: b = (XTX)-1XTY where Y is a column vector of the Y values and X is a matrix containing a column of ones (to pick up the intercept) followed by a column of the X variables containing the observations on them and b is a vector containing the estimators of regression parameters.
MATRIX ALGEBRA: SUMMARY A vector is a collection of n numbers or elements, collected either in a column (a column vector) or in a row (a row vector). A matrix is a collection, or array, of numbers of elements in which the elements are laid out in columns and rows. The dimension of matrix is nxm where n is the number of rows and m is the number of columns. Types of matrices A matrix is said to be square if the number of rows equals the number of columns. A square matrix is said to be symmetric if its (i, j) element equals its (j, i) element. A diagonal matrix is a square matrix in which all the off-diagonal elements equal zero, that is, if the square matrix A is diagonal, then aij=0 for i≠j. The transpose of a matrix switches the rows and the columns. That is, the transpose of a matrix turns the nxm matrix A into the m xn matrix denoted by AT, where the (i, j) element of A becomes the (j, i) element of AT; said differently, the transpose of a matrix A turns the rows of A into the columns of AT. The inverse of the matrix A is defined as the matrix for which A-1A=1. If in fact the inverse matrix A-1 exists, then A is said to be invertible or nonsingular. Vector and matrix multiplication The matrices A and B can be multiplied together if they are conformable, that is, if the number of columns of A equals the number of rows of B. In general, matrix multiplication does not commute, that is, in general AB≠ BA.
MULTIPLE REGRESSION WITH TWO EXPLANATORY VARIABLES: EXAMPLE Data for weekly salary based upon the length of employment and age of employees of a large industrial corporation are shown in the table. Calculate the OLS estimates for regression coefficients for the available sample. Comment on your results.