Download
1 / 19
190 likes | 339 Views
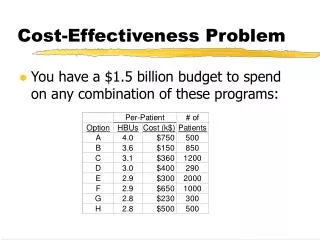
Cost-Effectiveness Problem. You have a $1.5 billion budget to spend on any combination of these programs:. Issue: Limited Resources. Assumption: There’s not enough money to fund every effective treatment (screening program, etc.)

E N D
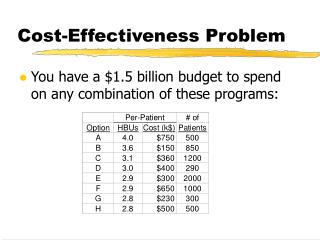
Cost-Effectiveness Problem • You have a $1.5 billion budget to spend on any combination of these programs:
Issue: Limited Resources • Assumption: There’s not enough money to fund every effective treatment (screening program, etc.) • Goal: Get the most health for our money. How can we allocate our fixed budget to provide the most health care?
Answer: Cost-Effectiveness • Determine how much health per dollar each intervention provides - its “cost-effectiveness” and how many of these interventions are needed • Fund interventions in decreasing order of cost-effectiveness until the budget is spent.
Cost-effectiveness • Fund I,B,G,E,C,D, and H for 291 patients:15,374.8 HBUs (3.06 per 5031 people)
Effectiveness only • Result: Fund A-D and E for 1498 patients:13,994.2 HBUs (3.21 per 4338 people)
Perspective • Patient perspective • Cost to patient (may be 0 due to insurance) • Health to patient • Payer’s perspective • Cost to payer (employer, HMO, insurance) • Health to patient pool • Social perspective • Cost to society, including lost productivity • Health to society
Measuring Costs • Costs are usually measured in dollars, adjusted for inflation over time. • Costs differ from charges, which include profits, market effects, etc. • Costs should include future related medical costs and savings. Future costs are discounted
Future Costs • Some argue that costs should include all future costs and savings (wages, etc.) If you do this: • Life-extending interventions become less cost-effective than life-enhancing interventions, because you’re usually extending low-quality life. • Life-saving interventions become less cost-effective in the elderly, who are net consumers, than in the young, who are net producers.
Benefit, Effectiveness, Utility • Cost-benefit analysis:Benefit in dollar units (e.g. willingness to pay for result) • Cost-effectiveness analysis: Benefit in health units (e.g. AIDS cases prevented, lives saved) • Cost-utility analysis: Benefit in utility (quality-of-life) units (e.g. QALYs)
Measuring Effectiveness • The recommended measure for cost-effectiveness is the quality-adjusted life year, a common unit for comparison. • QALYs = (time in state * utility of state) • 1 year of life in perfect health is as good as 2 years of life in 0.5 utility health. • Under $50,000 or $100,000/QALY is widely regarded as “cost-effective”
CEA problem 2From Stinnett & Paltiel’s CEA short course You must choose which of 5 mutually exclusive programs to fund. You currently fund option A. Considering your other decisions, you’re willing to spend up to an additional $200,000 per QALY.
Marginal CEA(aka Incremental CEA) • What if we have to weigh programs against each other, or determine if a new treatment is better to give than the current standard? • Marginal CEA focuses on how much more health could we get by spending an additional amount
CEA Problem 2 Step 1: Order the programs by cost. If some option costs more and delivers less than another, eliminate it from consideration.
CEA Problem 2 Step 2: Calculate a marginal CE ratio for each program, relative to the one above it.
CEA Problem 2 Step 3: Eliminate any program that has a higher marginal CE ratio than the program below it. If you’d spend $571k more to get 17.1 more QALYs, instead spend $175k more to get 17.9.
CEA Problem 2 Step 4: Recalculate marginal CE ratios and choose the program that has the largest marginal CE ratio that’s less than the threshold CE ratio ($200,000). In this case, neither C nor E meets our threshold. We should continue to fund A.
CEA GuidelinesThe Panel on Cost-Effectiveness in Health and Medicine (1993) 1. Reference case analysis • Societal perspective (resource allocation) • Compare interventions with status quo • Use QALYs; based utilities on community preferences, not patient preferences • Use direct and indirect costs, but need not include unrelated future health and non-health costs. Discount costs at 3%. 2. Perform sensitivity analysis
Conclusions • Cost-effectiveness analysis asks how to spend a fixed budget for the most health • The cost-effectiveness of an intervention is usually reported as its cost-per-QALY ratio. • Interventions with lower $/QALY are more cost-effective and should be preferred to interventions with higher $/QALY