Download
1 / 23
260 likes | 518 Views
Continuous Quality Improvement (CQI). Bethany Geldmaker PNP, PhD Tracy Jebo MPH. Learning Objectives. Provide Infant Mental Health Advisory Board with foundational Continuous Quality Improvement knowledge and skills Introduce the upcoming self-assessment survey.

E N D
Continuous Quality Improvement (CQI) Bethany Geldmaker PNP, PhD Tracy Jebo MPH
Learning Objectives Provide Infant Mental Health Advisory Board with foundational Continuous Quality Improvement knowledge and skills Introduce the upcoming self-assessment survey
Performance Management and CQI • Two components: • Performance Management: Using data to improve performance • CQI (Continuous Quality Improvement): Involving all stakeholders to examine the performance of a process and address identified gaps
Four Parts of Performance Management Performance Standards help agencies decide on the right path to take. Performance Measures help agencies follow their path without getting off track. Reporting of Progress helps agencies determine if they have made the right choices. Quality Improvement helps agencies keep getting better.
Performance Standards Objective standards or guidelines that are used to assess an organization's performance Identify relevant standards as described in your vision, mission, and strategic plan, and those supported by best practice policies . Select indicators of performance that align with each standard that can be tracked over time. Set targets for the performance of your agency related to each indicator. Communicate expectations for performance.
Weight Loss Example Performance Standards: Looking to the Body Mass Index chart for an ideal weight range (standards), and looking to lose two pounds per week (target) are based on standard recommendations for weight and weight loss.
Performance Measures Defining measures for each standard so you know what data you need. Measures need to be clearly and logically related to each standard, feasible to collect over time, within your scope of influence and consistent (ECMH Data Indicators) (e.g. % of live births that were preterm in 2013) Developing data systems to make sure data are collected routinely and stored appropriately, and Collecting data on a regular and ongoing basis.
Weight Loss Example Performance Standards: Looking to the Body Mass Index chart for an ideal weight range , and looking to lose two pounds per week are based on standard recommendations for weight and weight loss. Performance Measures: Recording (collecting data) weight, calories, and physical activity (defined measures) in a spreadsheet (data system) on a set schedule allows you to look at relevant data over time.
Reporting Progress • Analyze data and compare with their target • Communicate results broadly to all stakeholders • Provide context and be targeted to the audience • Be routine – reports should be produced on a schedule to help ensure that results are utilized • Be created in a way that is straightforward, easy to produce, and easy to understand, and • Creates a system that is transparent, which helps drive monitoring and improvement.
Weight Loss Example • Performance Standards: Looking to the Body Mass Index chart for an ideal weight range, and looking to lose two pounds per week are based on standard recommendations for weight and weight loss. • Performance Measures: Recording weight, calories, and physical activity in a spreadsheet on a set schedule allows you to look at relevant data over time. • Reporting of Progress: Examining (analyzing) the data on a set schedule (routine) allows you to monitor the data and observe trends.
Quality Improvement Uses data on how you are performing to drive activities which lead to true improvement. Utilizes stakeholders to address identified gaps continually improve processes Addresses the question: How do we get better?
Weight Loss Example • Performance Standards: Looking to the Body Mass Index chart for an ideal weight range and looking to lose two pounds per week are based on standard recommendations for weight and weight loss. • Performance Measures: Recording weight, calories, and physical activity a spreadsheet on a set schedule allows you to look at relevant data over time. • Reporting of Progress: Examining the data on a set schedule allows you to monitor the data and observe trends. • Quality Improvement: When the data showed (using data) that the targeted weight loss of two pounds per week wasn’t met, adding additional physical activity (improving process) was tested as an improvement strategy.
Performance Management, Evaluation, and Continuous Quality Improvement (CQI)
CQI: Four Principles • Continuous Quality Improvement is guided by four principles: • Focus on the individuals being served (in our case, individuals attending professional development trainings) • Continually improve all processes • Involve stakeholders (ECMHAB) • Mobilize both data and team knowledge to improve decision-making
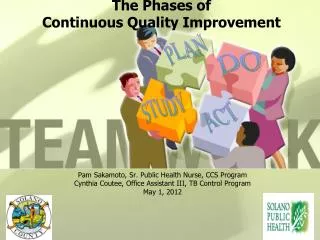
CQIProcess • The three key questions to keep front and center during all CQIwork are: • What are we trying to accomplish? • How will we know that a change is an improvement? • What changes can we make that will results in improvement? • These questions can be addressed through the use of a deliberate and defined improvement process, such as the Plan-Do-Study-Act Cycle
PDSA Cycle • The PDSA cycle is used to improve existing processes, not to plan or implement new programs • Always relies on data to support its decisions • Both the DSS and ECCS grant are focusing on professional development. By using CQI, we can systematically look at how our professional development activities impact participants
PDSA Cycle: Nine Steps • Plan-Do-Study-Act Cycle (Steps 1-5) • Step 1: Identifying a problem • Step 2: Assembling a CQIteam that can address the problem (ECMHAB) • Step 3: Identify what the true cause(s) of the problem may be, map the process to understand the existing activities that lead to the problematic issue • Step 4: Brainstorming and conducting background research to look for possible solutions • Step 5: Working to develop a theory of improvement that can be tested
What is a Process Map? • A process is a series of steps or actions performed to achieve a specific purpose. • Process map = Visual representation of steps in a process. • Describes the way things get done.
Plan-Do-Study-Act (Step 6) • Step 6: Test your theory of improvement • Implement a small-scale test of the change to your process. • Collect, chart, and display data to determine the effectiveness of the improvement. • Document problems, unexpected observations, and unintended side effects, because these occurrences will aid in the learning process.
Plan-Do-Study-Act (Step 7) • Step 7: Study the Results of your Test • Use data to determine if the test of your theory was successful • Compare the results of your test to the baseline data • Some questions to consider include: • Did your test work? What do the data show? • Did the results match your theory/prediction? • Are there trends in your data? • Did you have unintended side effects? • Is there improvement? • Do you need to test the improvement under other conditions?
Plan-Do-Study-Act (Steps 8 and 9) • Step 8: Either standardize your improvement (if test was successful) or develop a new theory for improvement (if test was unsuccessful) • Step 9: Establish Future Plans • Sustaining change or beginning PDSA again
The Self-Assessment Survey • The survey will be used to assess important components of the grant’s professional development activities: • Understanding consumer and capacity • Focus on providing high quality professional development • Using CQI principles and processes to optimize activities • Using data to drive decision making • The results of the survey will be used to identify potential areas that could benefit from a PDSA cycle