Download
1 / 18
190 likes | 799 Views
Introduction to Spectrophotometry. Properties of Light. Electromagnetic radiation moves in waves. Electromagnetic Spectrum. Electromagnetic Spectrum. Colors & Wavelengths. Visible Light. What is Colorimetry?. The solutions of many compounds have characteristic colors.

E N D
Properties of Light • Electromagnetic radiation moves in waves
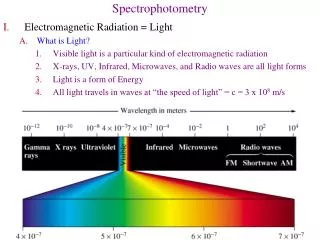
Colors & Wavelengths Visible Light
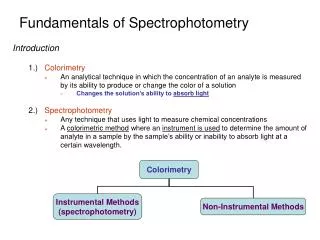
What is Colorimetry? • The solutions of many compounds have characteristic colors. • The intensity of such a color is proportional to the concentration of the compound.
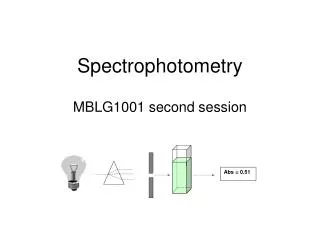
What are Spectroscopy and Spectrophotometry?? • Light can either be transmitted or absorbed by dissolved substances • Presence & concentration of dissolved substances is analyzed by passing light through the sample • Spectroscopes measure electromagnetic emission • Spectrophotometers measure electromagnetic absorption
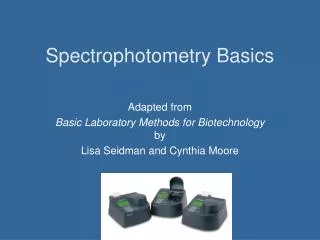
Instruments of Measurement • Two most common: • Visible Spectrophotometer • Spect 20, Spect 88 • Atomic-Absorption Spectrophotometer
Instruments of Measurement • What do visible spectrophotometers measure? • Amount of light absorbed by the dissolved substance • Qualitative • Quantitative
Absorption of Light • White light • All colors • Polychromatic light
Absorption of Light • Monochromatic light • Light of one color Red light is absorbed by the green solution
Definitions & Symbols • Intensity (I) • Transmittance (T) • It’s also referred to as %T or T x 100 • T = I/Io • Where Io is the intensity of the blank
Graphical Relationship • % transmission and % absorption are not linearly related to concentration • For a graph to be useful, a straight line is needed • ABSORBANCE = log(1/T) = -log(T)
Beer’s Law • The intensity of a ray of monochromatic light decreases exponentially as the concentration of the absorbing medium increases. • More dissolved substance = more absorption and less transmittance
Spectral Transmission Curve • Optimum wavelength
Standardization Graph • Standards (solutions of known concentration) of the compound of interest are made, treated, and their absorbances (ABS) and concentration values are used to create a Standardization Graph.